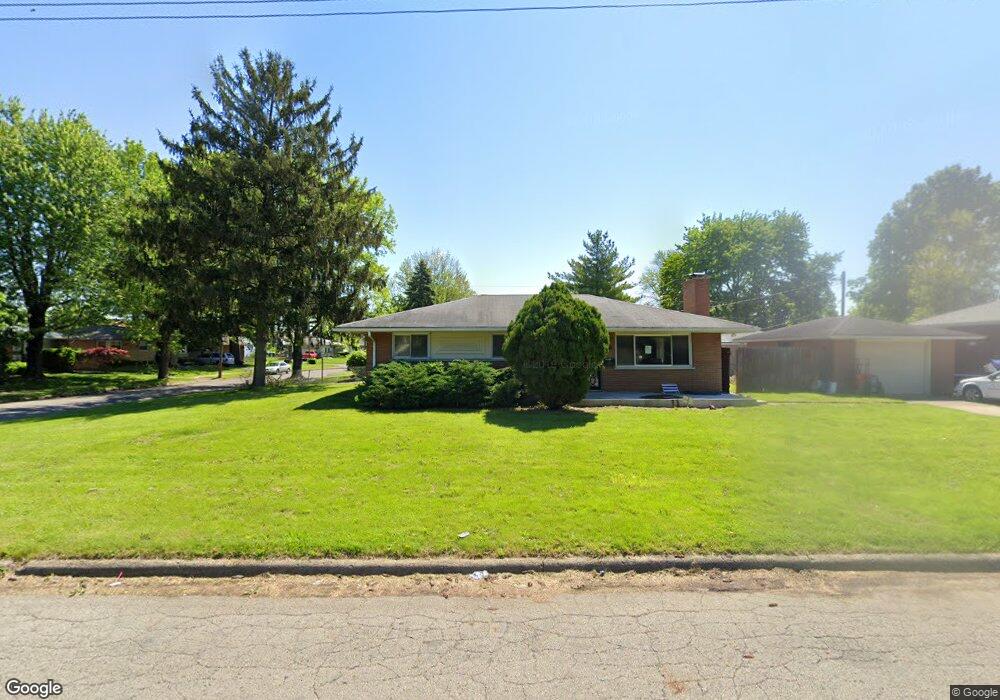
1408 Picard Rd Columbus, OH 43227
Linwood NeighborhoodEstimated Value: $196,676 - $233,000
3
Beds
2
Baths
1,134
Sq Ft
$192/Sq Ft
Est. Value
About This Home
This home is located at 1408 Picard Rd, Columbus, OH 43227 and is currently estimated at $217,419, approximately $191 per square foot. 1408 Picard Rd is a home located in Franklin County with nearby schools including Scottwood Elementary School, Johnson Park Middle School, and Walnut Ridge High School.
Ownership History
Date
Name
Owned For
Owner Type
Purchase Details
Closed on
May 28, 2019
Sold by
White Charles and Sessoms Jeannine L
Bought by
Wwsd Llc
Current Estimated Value
Purchase Details
Closed on
Apr 11, 2006
Sold by
Griffin Jason A and Griffin Monica
Bought by
Sessoms Jeannine L
Home Financials for this Owner
Home Financials are based on the most recent Mortgage that was taken out on this home.
Original Mortgage
$111,500
Interest Rate
6.48%
Mortgage Type
Purchase Money Mortgage
Purchase Details
Closed on
Sep 20, 2004
Sold by
Canada Harris and Canada Jeanette
Bought by
Griffin Jason A
Home Financials for this Owner
Home Financials are based on the most recent Mortgage that was taken out on this home.
Original Mortgage
$105,051
Interest Rate
5.95%
Mortgage Type
FHA
Purchase Details
Closed on
Mar 28, 1986
Bought by
Canada Harris and Canada Jeanette
Create a Home Valuation Report for This Property
The Home Valuation Report is an in-depth analysis detailing your home's value as well as a comparison with similar homes in the area
Home Values in the Area
Average Home Value in this Area
Purchase History
| Date | Buyer | Sale Price | Title Company |
|---|---|---|---|
| Wwsd Llc | $81,000 | Premier Title | |
| Sessoms Jeannine L | $112,000 | Trident Tit | |
| Griffin Jason A | $106,700 | -- | |
| Canada Harris | $48,500 | -- |
Source: Public Records
Mortgage History
| Date | Status | Borrower | Loan Amount |
|---|---|---|---|
| Previous Owner | Sessoms Jeannine L | $111,500 | |
| Previous Owner | Griffin Jason A | $105,051 |
Source: Public Records
Tax History
| Year | Tax Paid | Tax Assessment Tax Assessment Total Assessment is a certain percentage of the fair market value that is determined by local assessors to be the total taxable value of land and additions on the property. | Land | Improvement |
|---|---|---|---|---|
| 2025 | $3,049 | $66,540 | $13,690 | $52,850 |
| 2024 | $3,049 | $66,540 | $13,690 | $52,850 |
| 2023 | $3,011 | $66,535 | $13,685 | $52,850 |
| 2022 | $1,992 | $37,490 | $7,880 | $29,610 |
| 2021 | $2,384 | $37,490 | $7,880 | $29,610 |
| 2020 | $1,999 | $37,490 | $7,880 | $29,610 |
| 2019 | $1,931 | $31,050 | $6,550 | $24,500 |
| 2018 | $1,577 | $31,050 | $6,550 | $24,500 |
| 2017 | $1,269 | $31,050 | $6,550 | $24,500 |
| 2016 | $1,185 | $26,640 | $5,360 | $21,280 |
| 2015 | $1,076 | $26,640 | $5,360 | $21,280 |
| 2014 | $1,078 | $26,640 | $5,360 | $21,280 |
| 2013 | $620 | $29,610 | $5,950 | $23,660 |
Source: Public Records
Map
Nearby Homes
- 3585 Cushing Dr
- 1353 Barnett Rd
- 3457 Roswell Dr
- 3428 LIV Moor Dr
- 1623 Cunard Rd
- 1322 S Weyant Ave
- 3355 E Deshler Ave
- 3325 E Deshler Ave
- 1619 Basil Dr
- 1624 Miltwood Rd
- 3608 Bolton Ave
- 1685 Alcoy Dr
- 3716 Dort Place
- 3598 Astor Ave
- 3092-3094 Cressing Ct
- 1269 Carolwood Ave
- 1294 Dellwood Ave
- 1251 Dellwood Ave
- 1265 Elderwood Ave
- 1341 Millerdale Rd
- 3459 Seabrook Ave
- 1418 Picard Rd
- 3467 Seabrook Ave
- 1405 Picard Rd
- 1426 Picard Rd
- 3456 Seabrook Ave
- 1415 Picard Rd
- 1423 Cunard Rd
- 3462 Seabrook Ave
- 1413 Cunard Rd
- 3431 Seabrook Ave
- 1432 Picard Rd
- 3470 Seabrook Ave
- 1381 Picard Rd
- 1423 Picard Rd
- 1431 Cunard Rd
- 3423 Seabrook Ave
- 1391 Cunard Rd
- 3432 Seabrook Ave
- 1429 Picard Rd
Your Personal Tour Guide
Ask me questions while you tour the home.