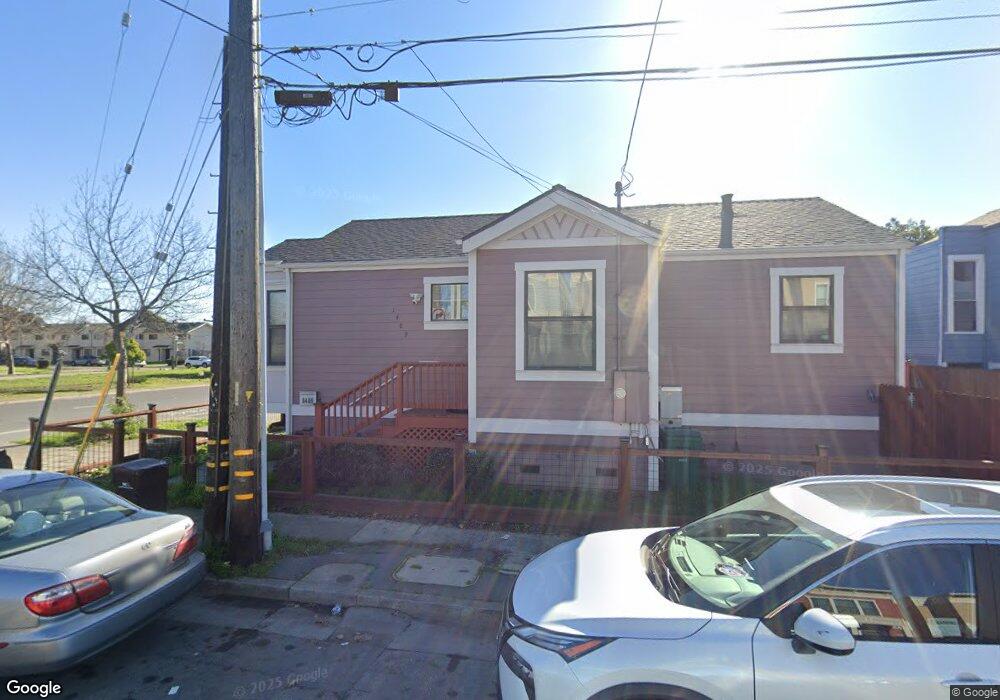
1409 11th St Oakland, CA 94607
West Oakland NeighborhoodEstimated Value: $593,000 - $826,000
3
Beds
2
Baths
1,318
Sq Ft
$524/Sq Ft
Est. Value
About This Home
This home is located at 1409 11th St, Oakland, CA 94607 and is currently estimated at $690,192, approximately $523 per square foot. 1409 11th St is a home located in Alameda County with nearby schools including Prescott Elementary School, West Oakland Middle School, and McClymonds High School.
Ownership History
Date
Name
Owned For
Owner Type
Purchase Details
Closed on
Feb 4, 2015
Sold by
Jenkins Barnes Stephanie and Jenkins Stephanie D
Bought by
Jenkins Barnes Stephanie and Barnes Delbert
Current Estimated Value
Home Financials for this Owner
Home Financials are based on the most recent Mortgage that was taken out on this home.
Original Mortgage
$285,000
Outstanding Balance
$218,289
Interest Rate
3.76%
Mortgage Type
New Conventional
Estimated Equity
$471,903
Purchase Details
Closed on
Jan 2, 1997
Sold by
Homeplace Initiatives Corp
Bought by
Jenkins Stephanie D
Home Financials for this Owner
Home Financials are based on the most recent Mortgage that was taken out on this home.
Original Mortgage
$79,000
Interest Rate
7.53%
Create a Home Valuation Report for This Property
The Home Valuation Report is an in-depth analysis detailing your home's value as well as a comparison with similar homes in the area
Home Values in the Area
Average Home Value in this Area
Purchase History
| Date | Buyer | Sale Price | Title Company |
|---|---|---|---|
| Jenkins Barnes Stephanie | -- | Old Republic Title Company | |
| Jenkins Stephanie D | $120,000 | First American Title |
Source: Public Records
Mortgage History
| Date | Status | Borrower | Loan Amount |
|---|---|---|---|
| Open | Jenkins Barnes Stephanie | $285,000 | |
| Closed | Jenkins Stephanie D | $79,000 | |
| Closed | Jenkins Stephanie D | $37,400 |
Source: Public Records
Tax History
| Year | Tax Paid | Tax Assessment Tax Assessment Total Assessment is a certain percentage of the fair market value that is determined by local assessors to be the total taxable value of land and additions on the property. | Land | Improvement |
|---|---|---|---|---|
| 2025 | $4,165 | $188,430 | $58,629 | $136,801 |
| 2024 | $4,165 | $184,598 | $57,479 | $134,119 |
| 2023 | $4,269 | $187,842 | $56,352 | $131,490 |
| 2022 | $4,097 | $177,160 | $55,248 | $128,912 |
| 2021 | $3,791 | $173,548 | $54,164 | $126,384 |
| 2020 | $3,746 | $178,698 | $53,609 | $125,089 |
| 2019 | $3,525 | $175,195 | $52,558 | $122,637 |
| 2018 | $3,454 | $171,761 | $51,528 | $120,233 |
| 2017 | $3,291 | $168,394 | $50,518 | $117,876 |
| 2016 | $3,106 | $165,093 | $49,528 | $115,565 |
| 2015 | $3,085 | $162,614 | $48,784 | $113,830 |
| 2014 | $3,027 | $159,428 | $47,828 | $111,600 |
Source: Public Records
Map
Nearby Homes