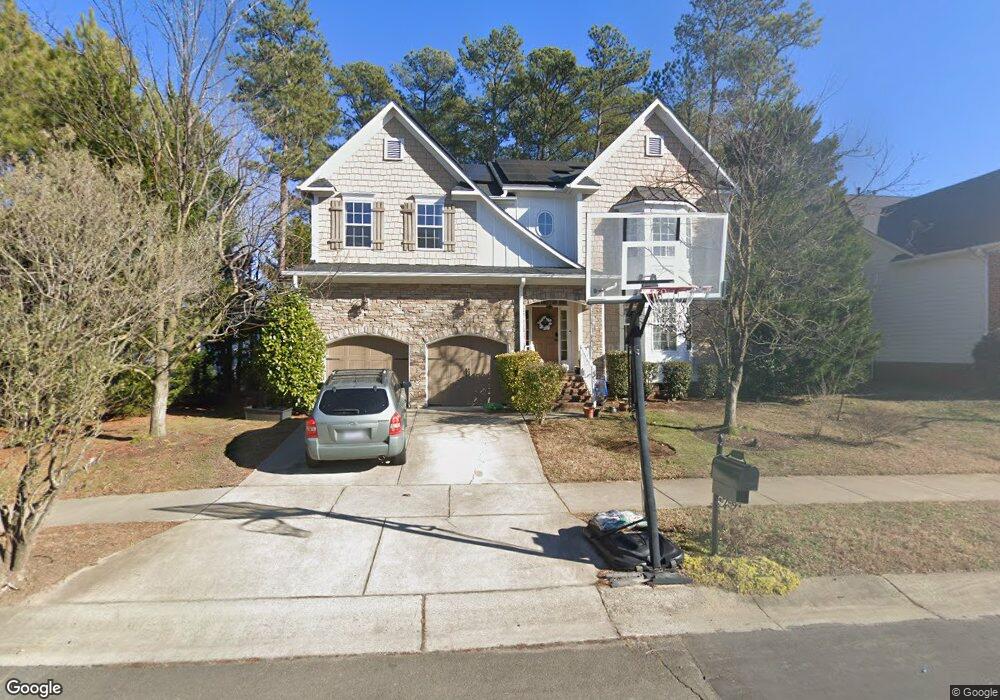
1409 Carrickfergus Ct Durham, NC 27713
Estimated Value: $673,808 - $750,000
5
Beds
3
Baths
3,347
Sq Ft
$215/Sq Ft
Est. Value
About This Home
This home is located at 1409 Carrickfergus Ct, Durham, NC 27713 and is currently estimated at $717,952, approximately $214 per square foot. 1409 Carrickfergus Ct is a home located in Durham County with nearby schools including Lowe's Grove Middle, Hillside High School, and Kestrel Heights School.
Ownership History
Date
Name
Owned For
Owner Type
Purchase Details
Closed on
Aug 14, 2014
Sold by
Daniels Forrest and Daniels Gladys
Bought by
Azhar Salman and Azhar Azleena S
Current Estimated Value
Purchase Details
Closed on
Jan 5, 2010
Sold by
Macinnis Lori Ann and Piotrowicz Tomasz
Bought by
Daniels Forrest
Home Financials for this Owner
Home Financials are based on the most recent Mortgage that was taken out on this home.
Original Mortgage
$333,841
Interest Rate
4.82%
Mortgage Type
FHA
Purchase Details
Closed on
Apr 22, 2005
Sold by
D R Horton Inc
Bought by
Macinnis Lori Ann and Piotrowicz Tomasz
Home Financials for this Owner
Home Financials are based on the most recent Mortgage that was taken out on this home.
Original Mortgage
$234,676
Interest Rate
4.87%
Mortgage Type
Fannie Mae Freddie Mac
Create a Home Valuation Report for This Property
The Home Valuation Report is an in-depth analysis detailing your home's value as well as a comparison with similar homes in the area
Home Values in the Area
Average Home Value in this Area
Purchase History
| Date | Buyer | Sale Price | Title Company |
|---|---|---|---|
| Azhar Salman | $330,000 | None Available | |
| Daniels Forrest | $340,000 | None Available | |
| Macinnis Lori Ann | $293,500 | -- |
Source: Public Records
Mortgage History
| Date | Status | Borrower | Loan Amount |
|---|---|---|---|
| Previous Owner | Daniels Forrest | $333,841 | |
| Previous Owner | Macinnis Lori Ann | $234,676 | |
| Closed | Macinnis Lori Ann | $29,284 |
Source: Public Records
Tax History Compared to Growth
Tax History
| Year | Tax Paid | Tax Assessment Tax Assessment Total Assessment is a certain percentage of the fair market value that is determined by local assessors to be the total taxable value of land and additions on the property. | Land | Improvement |
|---|---|---|---|---|
| 2025 | $4,892 | $608,288 | $137,250 | $471,038 |
| 2024 | $4,892 | $350,722 | $76,250 | $274,472 |
| 2023 | $4,594 | $350,722 | $76,250 | $274,472 |
| 2022 | $4,489 | $350,722 | $76,250 | $274,472 |
| 2021 | $4,468 | $350,722 | $76,250 | $274,472 |
| 2020 | $4,363 | $350,722 | $76,250 | $274,472 |
| 2019 | $4,363 | $350,722 | $76,250 | $274,472 |
| 2018 | $4,885 | $360,122 | $70,000 | $290,122 |
| 2017 | $4,849 | $360,122 | $70,000 | $290,122 |
| 2016 | $4,686 | $360,122 | $70,000 | $290,122 |
| 2015 | $4,631 | $334,532 | $63,200 | $271,332 |
| 2014 | $4,631 | $334,532 | $63,200 | $271,332 |
Source: Public Records
Map
Nearby Homes
- 903 Adeline Ct
- 708 Cheselden Dr
- 616 Cheselden Dr
- 211 Cool Spring Rd
- 12 Haycox Ct
- Torino Plan at The Courtyards at Southpoint
- 7409 Chesley Ln
- 7516 Massey Chapel Rd
- 120 James Ross Drive Rd
- 9 Monteith Ct
- 108 Ashmont Ln
- 233 S Bend Dr
- 1040 Bellenden Dr
- 8115 Massey Chapel Rd
- 1039 Bellenden Dr
- 203 S Bend Dr
- 204 S Bend Dr
- 205 Landreth Ct
- 1215 Bellenden Dr
- 7502 Hedfield Way
- 1411 Carrickfergus Ct
- 1405 Carrickfergus Ct
- 1510 Bally Castle Dr
- 1403 Carrickfergus Ct
- 1504 Bally Castle Dr
- 1512 Bally Castle Dr
- 1410 Carrickfergus Ct
- 1502 Bally Castle Dr
- 1412 Carrickfergus Ct
- 1514 Bally Castle Dr
- 905 Adeline Ct
- 1415 Carrickfergus Ct
- 102 Castlebar Ln
- 808 Adeline Ct
- 907 Adeline Ct
- 806 Adeline Ct
- 810 Adeline Ct
- 723 Adeline Ct
- 902 Adeline Ct
- 804 Adeline Ct