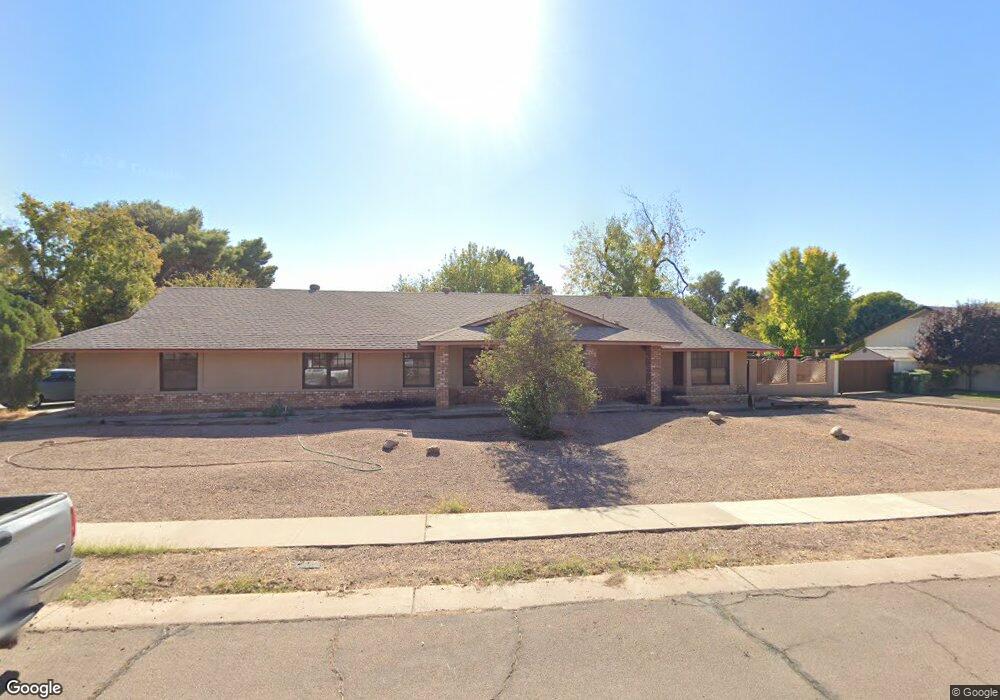
1409 E Secretariat Dr Tempe, AZ 85284
South Tempe NeighborhoodEstimated Value: $589,000 - $1,011,000
Studio
2
Baths
2,262
Sq Ft
$356/Sq Ft
Est. Value
About This Home
This home is located at 1409 E Secretariat Dr, Tempe, AZ 85284 and is currently estimated at $805,185, approximately $355 per square foot. 1409 E Secretariat Dr is a home located in Maricopa County with nearby schools including C I Waggoner School, Kyrene Middle School, and Corona Del Sol High School.
Ownership History
Date
Name
Owned For
Owner Type
Purchase Details
Closed on
Feb 17, 2025
Sold by
Cunningham James P and Cunningham Kathleen A
Bought by
James And Kathleen Cunningham Living Trust and Cunningham
Current Estimated Value
Purchase Details
Closed on
Jan 5, 2021
Sold by
Cunningham Kathleen Ann and Cunningham James P
Bought by
Cunningham James P
Purchase Details
Closed on
Jan 25, 1996
Sold by
Horton Janice
Bought by
Cunningham James P and Cunningham Kathleen A
Home Financials for this Owner
Home Financials are based on the most recent Mortgage that was taken out on this home.
Original Mortgage
$116,800
Interest Rate
7.25%
Create a Home Valuation Report for This Property
The Home Valuation Report is an in-depth analysis detailing your home's value as well as a comparison with similar homes in the area
Home Values in the Area
Average Home Value in this Area
Purchase History
| Date | Buyer | Sale Price | Title Company |
|---|---|---|---|
| James And Kathleen Cunningham Living Trust | -- | None Listed On Document | |
| Cunningham James P | -- | Chicago Title Agency | |
| Cunningham James P | -- | Old Republic Title Agency | |
| Horton Janice | -- | Old Republic Title Agency |
Source: Public Records
Mortgage History
| Date | Status | Borrower | Loan Amount |
|---|---|---|---|
| Previous Owner | Cunningham James P | $116,800 |
Source: Public Records
Tax History
| Year | Tax Paid | Tax Assessment Tax Assessment Total Assessment is a certain percentage of the fair market value that is determined by local assessors to be the total taxable value of land and additions on the property. | Land | Improvement |
|---|---|---|---|---|
| 2025 | $4,365 | $45,529 | -- | -- |
| 2024 | $4,095 | $43,361 | -- | -- |
| 2023 | $4,095 | $66,320 | $13,260 | $53,060 |
| 2022 | $3,877 | $48,930 | $9,780 | $39,150 |
| 2021 | $3,977 | $47,370 | $9,470 | $37,900 |
| 2020 | $3,876 | $46,810 | $9,360 | $37,450 |
| 2019 | $3,743 | $43,330 | $8,660 | $34,670 |
| 2018 | $3,611 | $39,460 | $7,890 | $31,570 |
| 2017 | $3,461 | $36,620 | $7,320 | $29,300 |
| 2016 | $3,510 | $37,200 | $7,440 | $29,760 |
| 2015 | $3,242 | $33,470 | $6,690 | $26,780 |
Source: Public Records
Map
Nearby Homes
- 7715 S Alder Dr
- 1338 E Sunburst Ln
- 1231 E Sunburst Ln
- 1315 E Mcnair Dr
- 1914 E Citation Ln
- 1861 E Krista Way
- 8125 S Taylor Dr
- 7716 S Rita Ln Unit 3
- 1060 E Louis Way Unit 14
- 1070 E Sunburst Ln
- 1922 E Palomino Dr
- 929 E Derby Dr
- 1960 E Krista Way
- 1971 E Buena Vista Dr
- 8870 S Heather Dr
- 1906 E Calle de Arcos
- 8852 S Lakeshore Dr
- 8648 S Kenwood Ln
- 1975 E Morgan Dr
- 758 E Sunburst Ln
- 1401 E Secretariat Dr
- 1417 E Secretariat Dr
- 1416 E Secretariat Dr
- 1408 E Secretariat Dr
- 1400 E Secretariat Dr
- 1431 E Secretariat Dr
- 1333 E Secretariat Dr
- 1432 E Secretariat Dr
- 1424 E Secretariat Dr
- 1439 E Secretariat Dr
- 1325 E Secretariat Dr
- 7910 S Juniper St
- 7918 S Juniper St
- 1426 E Citation Ln
- 1418 E Citation Ln
- 1434 E Citation Ln
- 1503 E Secretariat Dr
- 1442 E Citation Ln
- 1410 E Citation Ln
- 7902 S Juniper St
Your Personal Tour Guide
Ask me questions while you tour the home.