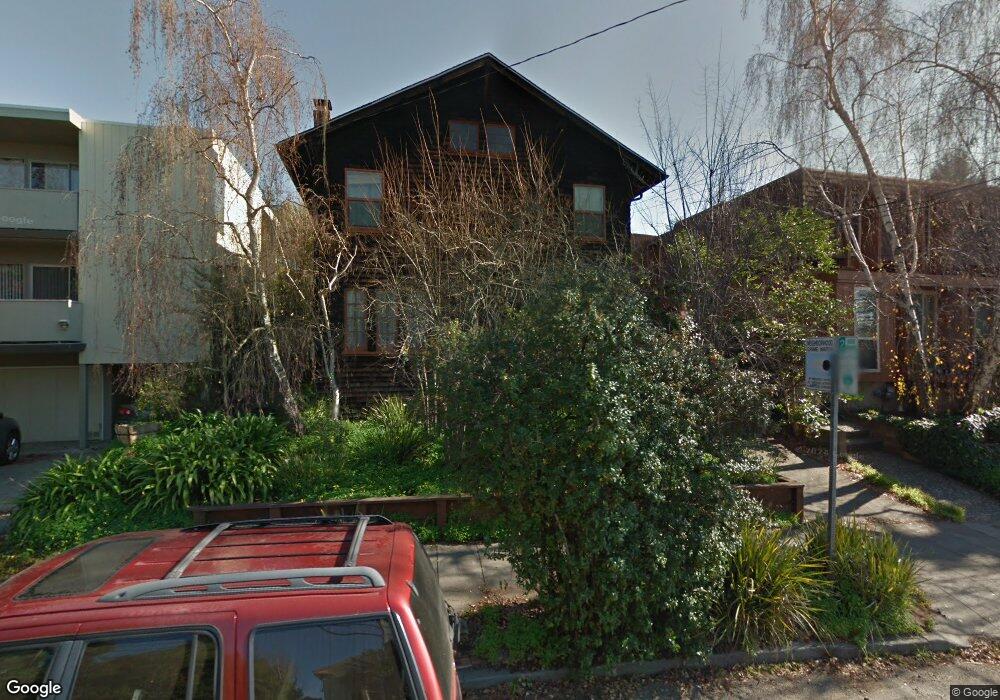
1409 Spruce St Unit B Berkeley, CA 94709
Berkeley Hills NeighborhoodEstimated Value: $532,000 - $669,000
1
Bed
1
Bath
645
Sq Ft
$924/Sq Ft
Est. Value
About This Home
This home is located at 1409 Spruce St Unit B, Berkeley, CA 94709 and is currently estimated at $595,816, approximately $923 per square foot. 1409 Spruce St Unit B is a home located in Alameda County with nearby schools including Berkeley Arts Magnet at Whittier School, Cragmont Elementary School, and Washington Elementary School.
Ownership History
Date
Name
Owned For
Owner Type
Purchase Details
Closed on
Dec 23, 2020
Sold by
Apert Alan and Barbara Alpert Survivors Trust
Bought by
Alpert Nancy and Nancy Alpert Trust
Current Estimated Value
Purchase Details
Closed on
Feb 8, 2016
Sold by
Alpert Barbara and Raymond & Barbara Alpert Trust
Bought by
Alpert Barbara and Barbara Alpert Survivors Trust
Purchase Details
Closed on
Feb 23, 2010
Sold by
Alpert Raymond and Alpert Barbara
Bought by
Alpert Raymond and Alpert Barbara
Purchase Details
Closed on
Feb 9, 2010
Sold by
Alport David
Bought by
Alpert Raymond and Alpert Barbara
Create a Home Valuation Report for This Property
The Home Valuation Report is an in-depth analysis detailing your home's value as well as a comparison with similar homes in the area
Home Values in the Area
Average Home Value in this Area
Purchase History
| Date | Buyer | Sale Price | Title Company |
|---|---|---|---|
| Alpert Nancy | $550,000 | Stewart Title Of California | |
| Alpert Barbara | -- | None Available | |
| Alpert Raymond | -- | Accommodation | |
| Alpert Raymond | $310,000 | Lawyers Title |
Source: Public Records
Tax History
| Year | Tax Paid | Tax Assessment Tax Assessment Total Assessment is a certain percentage of the fair market value that is determined by local assessors to be the total taxable value of land and additions on the property. | Land | Improvement |
|---|---|---|---|---|
| 2025 | $8,633 | $595,330 | $178,599 | $416,731 |
| 2024 | $8,633 | $583,660 | $175,098 | $408,562 |
| 2023 | $8,459 | $572,220 | $171,666 | $400,554 |
| 2022 | $8,322 | $561,000 | $168,300 | $392,700 |
| 2021 | $8,348 | $550,000 | $165,000 | $385,000 |
| 2020 | $5,777 | $365,874 | $109,762 | $256,112 |
| 2019 | $5,558 | $358,700 | $107,610 | $251,090 |
| 2018 | $5,464 | $351,670 | $105,501 | $246,169 |
| 2017 | $5,259 | $344,775 | $103,432 | $241,343 |
| 2016 | $5,090 | $338,017 | $101,405 | $236,612 |
| 2015 | $5,023 | $332,942 | $99,882 | $233,060 |
| 2014 | $4,990 | $326,423 | $97,927 | $228,496 |
Source: Public Records
Map
Nearby Homes
- 1515 Oxford St Unit 1D
- 1444 Walnut St
- 2501 Rose Walk
- 1622 Scenic Ave
- 1408 Henry St
- 2315 Eunice St
- 2121 Eunice St
- 2421 Hilgard Ave
- 1682 Oxford St
- 2201 Virginia St Unit 2
- 2340 Virginia St
- 2477 Virginia St
- 2451 Le Conte Ave
- 1739 Spruce St
- 1425 Martin Luther King jr Way
- 1610 Milvia St
- 2600 Hilgard Ave
- 1609 Bonita Ave Unit 5
- 2686 Shasta Rd
- 2035 Francisco St
- 1405 Spruce St
- 2224 Rose St
- 1409 Spruce St Unit A
- 1407 Spruce St
- 2238 Rose St
- 1411 Spruce St Unit 6
- 1411 Spruce St Unit 5
- 1411 Spruce St Unit 4
- 1411 Spruce St Unit 3
- 1411 Spruce St Unit 2
- 1411 Spruce St Unit 1
- 2240 Rose St
- 1408 Arch St
- 1395 Spruce St
- 1417 Spruce St Unit F
- 1417 Spruce St Unit E
- 1417 Spruce St Unit D
- 1417 Spruce St Unit C
- 1417 Spruce St Unit B
- 1417 Spruce St Unit A
Your Personal Tour Guide
Ask me questions while you tour the home.