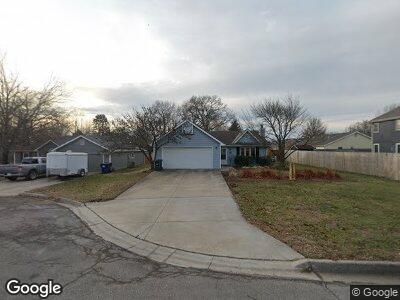
1409 Sundown Ct Lawrence, KS 66044
Estimated Value: $244,000 - $290,000
3
Beds
2
Baths
1,345
Sq Ft
$202/Sq Ft
Est. Value
About This Home
This home is located at 1409 Sundown Ct, Lawrence, KS 66044 and is currently estimated at $271,259, approximately $201 per square foot. 1409 Sundown Ct is a home located in Douglas County with nearby schools including Deerfield Elementary School, West Middle School, and Lawrence Free State High School.
Ownership History
Date
Name
Owned For
Owner Type
Purchase Details
Closed on
Jan 2, 2019
Sold by
Hinton Josh
Bought by
Margheim Laurice M and Margheim Carolyn V
Current Estimated Value
Purchase Details
Closed on
Jun 17, 2006
Sold by
Fullerton Scott M and Fullerton Stacey
Bought by
Hinton Neal Edward
Home Financials for this Owner
Home Financials are based on the most recent Mortgage that was taken out on this home.
Original Mortgage
$148,706
Outstanding Balance
$84,855
Interest Rate
5.5%
Mortgage Type
Purchase Money Mortgage
Estimated Equity
$186,404
Purchase Details
Closed on
Mar 18, 2001
Sold by
Cobb E Benton
Bought by
Fullerton Scott M and Fullerton Stacey
Home Financials for this Owner
Home Financials are based on the most recent Mortgage that was taken out on this home.
Original Mortgage
$104,500
Interest Rate
6.98%
Mortgage Type
Purchase Money Mortgage
Create a Home Valuation Report for This Property
The Home Valuation Report is an in-depth analysis detailing your home's value as well as a comparison with similar homes in the area
Home Values in the Area
Average Home Value in this Area
Purchase History
| Date | Buyer | Sale Price | Title Company |
|---|---|---|---|
| Margheim Laurice M | $157,500 | Continental Title | |
| Hinton Neal Edward | -- | Commerce Title | |
| Fullerton Scott M | -- | Commerce Title |
Source: Public Records
Mortgage History
| Date | Status | Borrower | Loan Amount |
|---|---|---|---|
| Open | Hinton Neal Edward | $148,706 | |
| Previous Owner | Fullerton Scott M | $104,500 |
Source: Public Records
Tax History Compared to Growth
Tax History
| Year | Tax Paid | Tax Assessment Tax Assessment Total Assessment is a certain percentage of the fair market value that is determined by local assessors to be the total taxable value of land and additions on the property. | Land | Improvement |
|---|---|---|---|---|
| 2024 | $3,547 | $28,992 | $7,475 | $21,517 |
| 2023 | $3,265 | $25,634 | $6,900 | $18,734 |
| 2022 | $2,929 | $22,887 | $4,600 | $18,287 |
| 2021 | $2,596 | $19,562 | $4,368 | $15,194 |
| 2020 | $2,388 | $18,113 | $4,368 | $13,745 |
| 2019 | $2,385 | $18,112 | $3,798 | $14,314 |
| 2018 | $2,311 | $17,434 | $3,571 | $13,863 |
| 2017 | $2,278 | $16,997 | $3,571 | $13,426 |
| 2016 | $2,078 | $16,215 | $4,028 | $12,187 |
| 2015 | $2,090 | $16,307 | $4,028 | $12,279 |
| 2014 | $2,114 | $16,652 | $4,028 | $12,624 |
Source: Public Records
Map
Nearby Homes
- 504 Lone Tree Dr
- 255 N Michigan St Unit 82
- 255 N Michigan St Unit 78
- 1506 Pin Oak Dr
- 1612 Northwood Dr
- 121 Florida St
- 1612 Kenwood Dr
- 2412 Brett Dr
- 620 Durham Ct
- 515 McDonald Dr
- 521 Durham Ct
- 312 Birch Ln
- 1420 W 4th St
- 312 Bowstring Dr
- 413 Michigan St
- 322 Indiana St
- 2901 Colt Dr
- 420 Michigan St
- 417 Alabama St
- 223 Lyon St
- 1409 Sundown Ct
- 1405 Sundown Ct
- 518 Sandpiper Dr
- 514 Sandpiper Dr
- 1401 Sundown Ct
- 510 Sandpiper Dr
- 417 N Michigan St
- 1402 Sundown Ct
- 522 Sandpiper Dr
- 506 Sandpiper Dr
- 1406 Sundown Ct
- 521 Sandpiper Dr
- 517 Sandpiper Dr
- 525 Sandpiper Dr
- 513 Sandpiper Dr
- 529 Sandpiper Dr
- 509 Sandpiper Dr
- 502 Sandpiper Dr
- 533 Sandpiper Dr
- 1742 E 1350 Rd