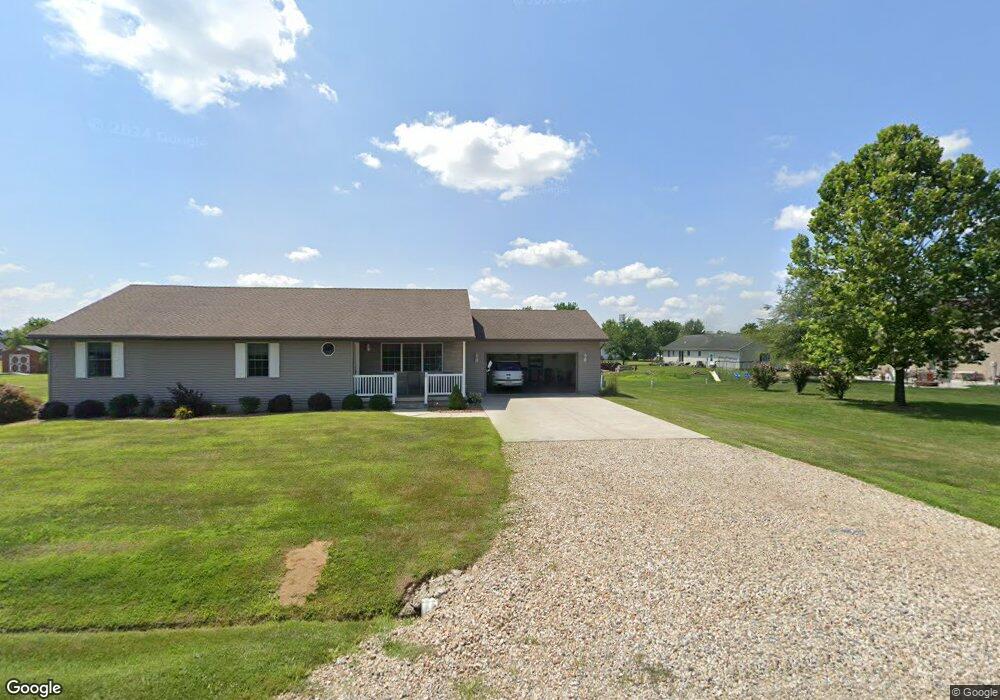
14090 E Dutch Ln Effingham, IL 62401
Estimated Value: $242,000 - $335,000
3
Beds
2
Baths
1,891
Sq Ft
$159/Sq Ft
Est. Value
About This Home
This home is located at 14090 E Dutch Ln, Effingham, IL 62401 and is currently estimated at $300,873, approximately $159 per square foot. 14090 E Dutch Ln is a home located in Effingham County with nearby schools including Central Grade School, Early Learning Center, and South Side Grade School.
Ownership History
Date
Name
Owned For
Owner Type
Purchase Details
Closed on
May 14, 2008
Sold by
Reimers Richard D
Bought by
Hirtzel Kaleb L and Hirtzel Elise M
Current Estimated Value
Home Financials for this Owner
Home Financials are based on the most recent Mortgage that was taken out on this home.
Original Mortgage
$150,000
Outstanding Balance
$95,242
Interest Rate
5.93%
Mortgage Type
New Conventional
Estimated Equity
$205,631
Purchase Details
Closed on
Oct 28, 2005
Sold by
Zimmerman Richard and Richard Zimmerman Trust
Bought by
Reimers Richard D
Home Financials for this Owner
Home Financials are based on the most recent Mortgage that was taken out on this home.
Original Mortgage
$108,800
Interest Rate
5.98%
Mortgage Type
New Conventional
Create a Home Valuation Report for This Property
The Home Valuation Report is an in-depth analysis detailing your home's value as well as a comparison with similar homes in the area
Home Values in the Area
Average Home Value in this Area
Purchase History
| Date | Buyer | Sale Price | Title Company |
|---|---|---|---|
| Hirtzel Kaleb L | -- | None Available | |
| Reimers Richard D | $136,000 | None Available |
Source: Public Records
Mortgage History
| Date | Status | Borrower | Loan Amount |
|---|---|---|---|
| Open | Hirtzel Kaleb L | $150,000 | |
| Previous Owner | Reimers Richard D | $108,800 |
Source: Public Records
Tax History Compared to Growth
Tax History
| Year | Tax Paid | Tax Assessment Tax Assessment Total Assessment is a certain percentage of the fair market value that is determined by local assessors to be the total taxable value of land and additions on the property. | Land | Improvement |
|---|---|---|---|---|
| 2024 | $4,411 | $87,400 | $10,200 | $77,200 |
| 2023 | $3,997 | $79,090 | $9,230 | $69,860 |
| 2022 | $3,702 | $71,900 | $8,390 | $63,510 |
| 2021 | $3,759 | $72,620 | $8,470 | $64,150 |
| 2020 | $3,651 | $70,230 | $8,190 | $62,040 |
| 2019 | $3,536 | $68,180 | $7,950 | $60,230 |
| 2018 | $2,883 | $65,550 | $7,640 | $57,910 |
| 2017 | $2,834 | $63,640 | $7,420 | $56,220 |
| 2016 | $2,754 | $61,190 | $7,130 | $54,060 |
| 2015 | -- | $59,990 | $6,990 | $53,000 |
| 2014 | -- | $49,870 | $6,790 | $43,080 |
| 2013 | -- | $49,870 | $6,790 | $43,080 |
| 2012 | -- | $49,370 | $6,720 | $42,650 |
Source: Public Records
Map
Nearby Homes
- 14326 E Persimmon Ave
- 14163 E Libbie Ln
- 15690 E 1100th Ave
- 3020 Sugar Mill Ct
- 31 Easy Breeze
- 8434 N Meadowview Rd
- 103 E Mount Vernon Ave
- 102 Davis Dr
- 100 Chaparral St
- 103 Oak Dr
- 504 A&B E Hendelmeyer Ave Unit B
- 105 W Kagay Ave
- 103 W Kagay Ave
- 1601 S Park St
- 220 S East St
- 1005 S 3rd St
- 601 E Dogwood Ave
- 812 S 4th St
- 704 S Pembroke St
- 1003 Lynn Dr
- 14100 E Dutch Ln
- 9984 N Country Dr
- 9964 N Country Dr
- 9994 N Harvest Ln
- 9974 N Harvest Ln
- 9924 N Country Dr
- 9979 N Country Dr
- 9969 N Country Dr
- 9995 N Country Dr
- 9904 N Country Dr
- 14150 E Dutch Ln
- 14129 E Dutch Ln
- 9948 N Briar Ln
- 9972 N Briar Ln
- 9880 N Country Dr
- 9880 N Country Dr
- 9918 N Briar Ln
- 9859 Southtown Dr
- 14169 E Dutch Ln
- 14103 N Southtown Dr