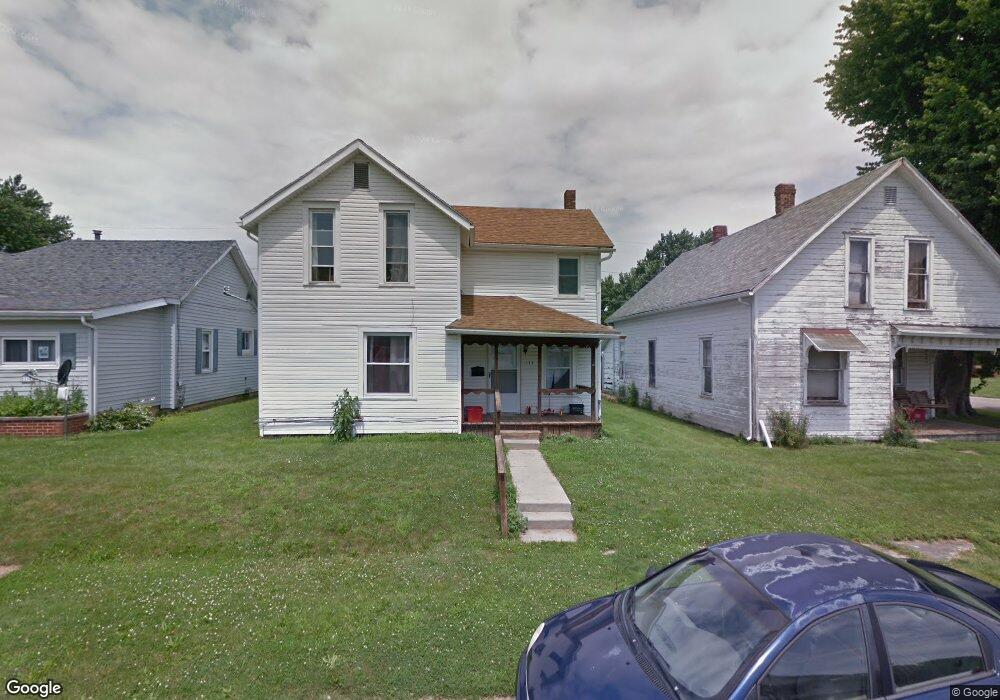
141 Brumm St Kenton, OH 43326
Estimated Value: $101,000 - $136,000
3
Beds
1
Bath
1,440
Sq Ft
$83/Sq Ft
Est. Value
About This Home
This home is located at 141 Brumm St, Kenton, OH 43326 and is currently estimated at $119,000, approximately $82 per square foot. 141 Brumm St is a home located in Hardin County with nearby schools including Kenton Elementary School, Kenton Middle School, and Kenton High School.
Ownership History
Date
Name
Owned For
Owner Type
Purchase Details
Closed on
Jul 2, 2021
Sold by
Cmfh Llc
Bought by
419Rent Llc
Current Estimated Value
Home Financials for this Owner
Home Financials are based on the most recent Mortgage that was taken out on this home.
Original Mortgage
$640,000
Outstanding Balance
$535,393
Interest Rate
2.9%
Mortgage Type
Future Advance Clause Open End Mortgage
Estimated Equity
-$416,393
Purchase Details
Closed on
May 23, 2007
Sold by
Hsbc Bank Usa
Bought by
Henson Corey
Purchase Details
Closed on
Nov 8, 2006
Sold by
Leeth Craig D
Bought by
Hsbc Bank Usa National Association
Purchase Details
Closed on
Sep 22, 2003
Bought by
Wren Billy L and Wren Peggy A
Purchase Details
Closed on
May 12, 2003
Bought by
Chamberlain Clifford L
Create a Home Valuation Report for This Property
The Home Valuation Report is an in-depth analysis detailing your home's value as well as a comparison with similar homes in the area
Home Values in the Area
Average Home Value in this Area
Purchase History
| Date | Buyer | Sale Price | Title Company |
|---|---|---|---|
| 419Rent Llc | $320,000 | None Available | |
| Henson Corey | $21,000 | None Available | |
| Hsbc Bank Usa National Association | $39,375 | None Available | |
| Wren Billy L | $42,500 | -- | |
| Chamberlain Clifford L | $15,000 | -- |
Source: Public Records
Mortgage History
| Date | Status | Borrower | Loan Amount |
|---|---|---|---|
| Open | 419Rent Llc | $640,000 |
Source: Public Records
Tax History Compared to Growth
Tax History
| Year | Tax Paid | Tax Assessment Tax Assessment Total Assessment is a certain percentage of the fair market value that is determined by local assessors to be the total taxable value of land and additions on the property. | Land | Improvement |
|---|---|---|---|---|
| 2024 | $1,150 | $20,540 | $1,520 | $19,020 |
| 2023 | $1,150 | $20,540 | $1,520 | $19,020 |
| 2022 | $851 | $17,760 | $1,060 | $16,700 |
| 2021 | $854 | $17,760 | $1,060 | $16,700 |
| 2020 | $846 | $17,760 | $1,060 | $16,700 |
| 2019 | $742 | $14,140 | $1,010 | $13,130 |
| 2018 | $606 | $14,140 | $1,010 | $13,130 |
| 2017 | $615 | $14,140 | $1,010 | $13,130 |
| 2016 | $550 | $11,300 | $1,110 | $10,190 |
| 2015 | $418 | $11,300 | $1,110 | $10,190 |
| 2014 | $537 | $11,300 | $1,110 | $10,190 |
| 2013 | $860 | $12,430 | $1,110 | $11,320 |
Source: Public Records
Map
Nearby Homes
- 639 S Main St
- 727 S Detroit St
- 508 Decatur St
- 510 Decatur St
- 320 Letson Ave
- 121 S High St
- 920 Cooper St
- 530 E Franklin St
- 513 E Franklin St
- 115 Scioto St
- 39 Grape St
- 414 Robinson Ave
- 79 Broadway St
- 509 E Carrol St
- 219 W Carrol St
- 215 N Main St
- 233 N Main St
- 310 N Market St
- 328 N Detroit St
- 424 W Carrol St