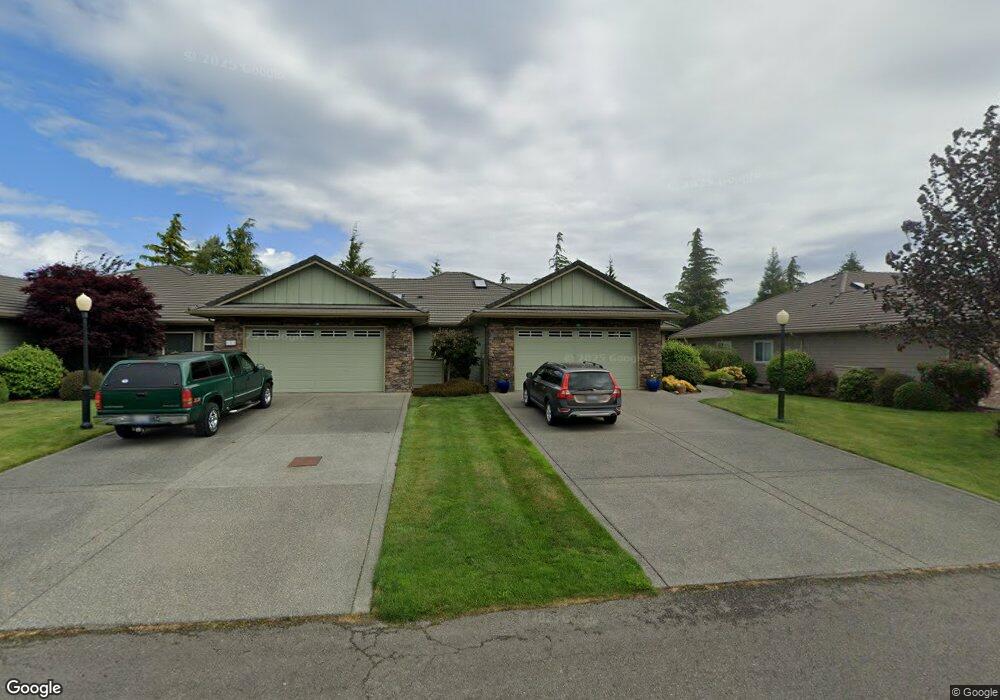
141 Cascadia Loop Sequim, WA 98382
Estimated Value: $468,129 - $535,000
2
Beds
2
Baths
1,560
Sq Ft
$326/Sq Ft
Est. Value
About This Home
This home is located at 141 Cascadia Loop, Sequim, WA 98382 and is currently estimated at $508,043, approximately $325 per square foot. 141 Cascadia Loop is a home located in Clallam County with nearby schools including Helen Haller Elementary School, Sequim Middle School, and Sequim Senior High School.
Ownership History
Date
Name
Owned For
Owner Type
Purchase Details
Closed on
Dec 11, 2012
Sold by
Thompson Richard D
Bought by
Thompson Virginia L and Hammond Virginia L
Current Estimated Value
Home Financials for this Owner
Home Financials are based on the most recent Mortgage that was taken out on this home.
Original Mortgage
$160,300
Outstanding Balance
$110,957
Interest Rate
3.35%
Mortgage Type
New Conventional
Estimated Equity
$397,086
Purchase Details
Closed on
Apr 14, 2009
Sold by
Hammond Virginia L and The Virginia L Hammond Revocab
Bought by
Hammond Virginia L
Purchase Details
Closed on
Nov 8, 2007
Sold by
Hammond Virginia L
Bought by
Hammond Virginia L and Hammond Revocable T Virginia L
Purchase Details
Closed on
Aug 3, 2006
Sold by
Kevin Estes Homes Llc
Bought by
Hammond Virginia L
Home Financials for this Owner
Home Financials are based on the most recent Mortgage that was taken out on this home.
Original Mortgage
$169,950
Interest Rate
6.76%
Mortgage Type
New Conventional
Create a Home Valuation Report for This Property
The Home Valuation Report is an in-depth analysis detailing your home's value as well as a comparison with similar homes in the area
Purchase History
| Date | Buyer | Sale Price | Title Company |
|---|---|---|---|
| Thompson Virginia L | -- | Olympic Peninsula Title Comp | |
| Hammond Virginia L | -- | Clallam Title Co | |
| Hammond Virginia L | -- | None Available | |
| Hammond Virginia L | $289,950 | Clallam Title Ci |
Source: Public Records
Mortgage History
| Date | Status | Borrower | Loan Amount |
|---|---|---|---|
| Open | Thompson Virginia L | $160,300 | |
| Previous Owner | Hammond Virginia L | $169,950 |
Source: Public Records
Tax History
| Year | Tax Paid | Tax Assessment Tax Assessment Total Assessment is a certain percentage of the fair market value that is determined by local assessors to be the total taxable value of land and additions on the property. | Land | Improvement |
|---|---|---|---|---|
| 2025 | $3,375 | $443,282 | $60,000 | $383,282 |
| 2023 | $3,375 | $456,686 | $60,000 | $396,686 |
| 2022 | $3,232 | $420,017 | $60,000 | $360,017 |
| 2021 | $2,962 | $354,705 | $60,000 | $294,705 |
| 2020 | $3,186 | $320,975 | $41,006 | $279,969 |
| 2018 | $2,567 | $274,314 | $41,006 | $233,308 |
| 2017 | $2,236 | $226,323 | $41,006 | $185,317 |
| 2016 | $2,236 | $235,443 | $41,006 | $194,437 |
| 2015 | $2,236 | $227,789 | $41,006 | $186,783 |
| 2013 | $2,236 | $192,736 | $41,006 | $151,730 |
| 2012 | $2,236 | $224,813 | $46,474 | $178,339 |
Source: Public Records
Map
Nearby Homes
- 191 Cascadia Loop
- 40 Cascadia Loop
- 126 Hilltop Dr Unit C
- 126 Hilltop Dr Unit C
- 292 Foursome Dr
- 290 Foursome Dr
- 185 Fairway Dr
- 115 Fairway Dr
- 111 Mount Baker Dr
- 136 Sunset Place
- 192 Sunset Place
- 213 Sunset Place
- 109 Vancouver Place
- 117 Williams Place
- 181 Sunland Dr
- 352 Woodland Dr
- 179 Hurricane Ridge Dr
- 113 San Juan Dr
- 71 John Carl Rd
- 190 San Juan Dr
- 100 Cascadia Loop
- 100 Cascadia Loop Unit B
- 191 Cascadia Loop
- 191 Cascadia Loop Unit B
- 150 Cascadia Loop
- 160 Cascadia Loop
- 140 Cascadia Loop
- 130 Cascadia Loop
- 110 Cascadia Loop
- 120 Cascadia Loop Unit 18B
- 120 Cascadia Loop Unit 18B
- 131 Cascadia Loop
- 151 Cascadia Loop Unit 43A
- 151 Cascadia Loop
- 180 Cascadia Loop Unit LP
- 180 Cascadia Loop
- 170 Cascadia Loop
- 90 Cascadia Loop
- 190 Cascadia Loop
Your Personal Tour Guide
Ask me questions while you tour the home.