Estimated Value: $315,000 - $366,000
2
Beds
2
Baths
1,438
Sq Ft
$236/Sq Ft
Est. Value
About This Home
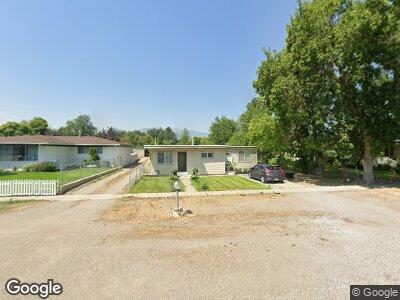
This home is located at 141 N 100 W, Hyrum, UT 84319 and is currently estimated at $339,236, approximately $235 per square foot. 141 N 100 W is a home located in Cache County with nearby schools including Lincoln School, South Cache Middle School, and Mountain Crest High School.
Ownership History
Date
Name
Owned For
Owner Type
Purchase Details
Closed on
Nov 30, 2020
Sold by
Fredrickson Joseph
Bought by
Bunce Jaymes B and Bunce Emily S
Current Estimated Value
Home Financials for this Owner
Home Financials are based on the most recent Mortgage that was taken out on this home.
Original Mortgage
$253,653
Outstanding Balance
$228,783
Interest Rate
2.8%
Mortgage Type
FHA
Estimated Equity
$110,453
Purchase Details
Closed on
Jul 25, 2018
Sold by
Bassett Stanley C and George Calvin Bassett Inter Vi
Bought by
Fredrickson Joseph
Purchase Details
Closed on
Mar 24, 2016
Sold by
Atkinson David L and The Kendall Lee Atkinson Livin
Bought by
Fredrickson Joseph
Home Financials for this Owner
Home Financials are based on the most recent Mortgage that was taken out on this home.
Original Mortgage
$5,800
Interest Rate
3.62%
Mortgage Type
Stand Alone Second
Purchase Details
Closed on
Dec 21, 2000
Sold by
Atkinson Kendall Lee
Bought by
Kendall Lee Atkinson Living Trust
Create a Home Valuation Report for This Property
The Home Valuation Report is an in-depth analysis detailing your home's value as well as a comparison with similar homes in the area
Home Values in the Area
Average Home Value in this Area
Purchase History
| Date | Buyer | Sale Price | Title Company |
|---|---|---|---|
| Bunce Jaymes B | -- | American Secure Title Logan | |
| Fredrickson Joseph | -- | None Available | |
| Fredrickson Joseph | -- | American Secure Title | |
| Kendall Lee Atkinson Living Trust | -- | -- |
Source: Public Records
Mortgage History
| Date | Status | Borrower | Loan Amount |
|---|---|---|---|
| Open | Bunce Jaymes B | $253,653 | |
| Closed | Bunce Jaymes B | $13,800 | |
| Previous Owner | Atkinson David L | $5,800 | |
| Previous Owner | Fredrickson Joseph | $116,844 |
Source: Public Records
Tax History Compared to Growth
Tax History
| Year | Tax Paid | Tax Assessment Tax Assessment Total Assessment is a certain percentage of the fair market value that is determined by local assessors to be the total taxable value of land and additions on the property. | Land | Improvement |
|---|---|---|---|---|
| 2024 | $1,285 | $172,290 | $0 | $0 |
| 2023 | $1,363 | $174,750 | $0 | $0 |
| 2022 | $1,422 | $174,750 | $0 | $0 |
| 2021 | $1,331 | $251,980 | $64,130 | $187,850 |
| 2020 | $1,175 | $208,630 | $64,130 | $144,500 |
| 2019 | $1,083 | $180,940 | $36,440 | $144,500 |
| 2018 | $794 | $128,168 | $36,440 | $91,728 |
| 2017 | $777 | $65,085 | $0 | $0 |
| 2016 | $794 | $55,720 | $0 | $0 |
| 2015 | $661 | $54,005 | $0 | $0 |
| 2014 | $644 | $53,840 | $0 | $0 |
| 2013 | -- | $52,905 | $0 | $0 |
Source: Public Records