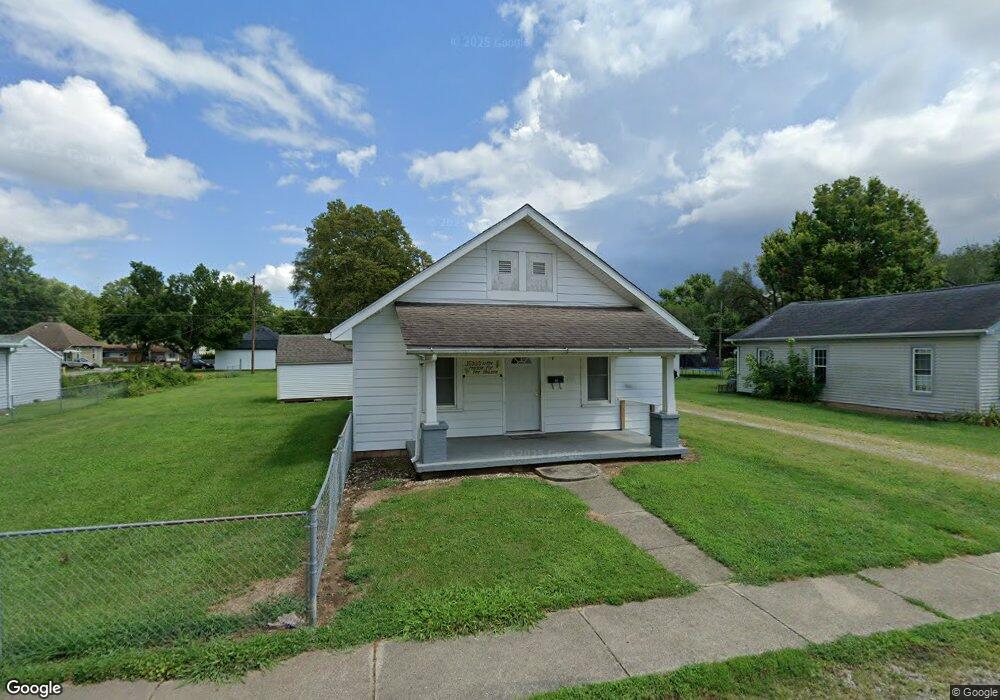
141 N Ross St Columbus, IN 47201
Estimated Value: $152,000 - $193,000
2
Beds
1
Bath
1,018
Sq Ft
$168/Sq Ft
Est. Value
About This Home
This home is located at 141 N Ross St, Columbus, IN 47201 and is currently estimated at $170,841, approximately $167 per square foot. 141 N Ross St is a home located in Bartholomew County with nearby schools including Clifty Creek Elementary School, Central Middle School, and Columbus East High School.
Ownership History
Date
Name
Owned For
Owner Type
Purchase Details
Closed on
Nov 25, 2008
Sold by
Not Provided
Bought by
Lazzell Oren A and Lazzell Jerry A
Current Estimated Value
Purchase Details
Closed on
Sep 12, 2008
Sold by
Federal National Mortgage Association
Bought by
Lazzell Oren A
Purchase Details
Closed on
Jun 23, 2008
Sold by
First Horizon Home Loans
Bought by
Federal National Mortgage Association
Purchase Details
Closed on
Feb 19, 2002
Sold by
William Blanford and William Hilda M
Bought by
Blanford William and Blanford Hilda M
Create a Home Valuation Report for This Property
The Home Valuation Report is an in-depth analysis detailing your home's value as well as a comparison with similar homes in the area
Home Values in the Area
Average Home Value in this Area
Purchase History
| Date | Buyer | Sale Price | Title Company |
|---|---|---|---|
| Lazzell Oren A | $28,000 | -- | |
| Lazzell Oren A | $28,000 | Title One & Real Estate Exch | |
| Not Provided | $28,000 | Title One | |
| Lazzell Oren A | $28,000 | Title One & Real Estate Exch | |
| Federal National Mortgage Association | -- | None Available | |
| Blanford William | -- | -- |
Source: Public Records
Tax History Compared to Growth
Tax History
| Year | Tax Paid | Tax Assessment Tax Assessment Total Assessment is a certain percentage of the fair market value that is determined by local assessors to be the total taxable value of land and additions on the property. | Land | Improvement |
|---|---|---|---|---|
| 2024 | $1,065 | $135,000 | $37,200 | $97,800 |
| 2023 | $914 | $126,800 | $37,200 | $89,600 |
| 2022 | $914 | $118,100 | $37,200 | $80,900 |
| 2021 | $421 | $88,400 | $19,200 | $69,200 |
| 2020 | $195 | $74,600 | $19,200 | $55,400 |
| 2019 | $141 | $0 | $0 | $0 |
| 2018 | $143 | $68,900 | $19,200 | $49,700 |
| 2017 | $142 | $68,500 | $18,600 | $49,900 |
| 2016 | $128 | $66,900 | $18,600 | $48,300 |
| 2014 | $119 | $65,900 | $18,600 | $47,300 |
Source: Public Records
Map
Nearby Homes
- 41 N Ross St
- 2651 Clifty St
- 51 S Brooks St
- 41 N Cherry St
- 2263 Wallace Ave
- 2905 Kentucky Ave
- 507 N Cherry St
- 2032 Indiana Ave
- 2041 Mckinley Ave
- 661 Smith St
- 213 Hege Ave
- 758 N Cherry St
- 2921 10th St
- 342 Jones St
- 212 S Beatty St
- 2035 10th St
- 1631 Kentucky Ave
- 52 N Hinman St
- 1521 Indiana Ave
- 2855 12th St