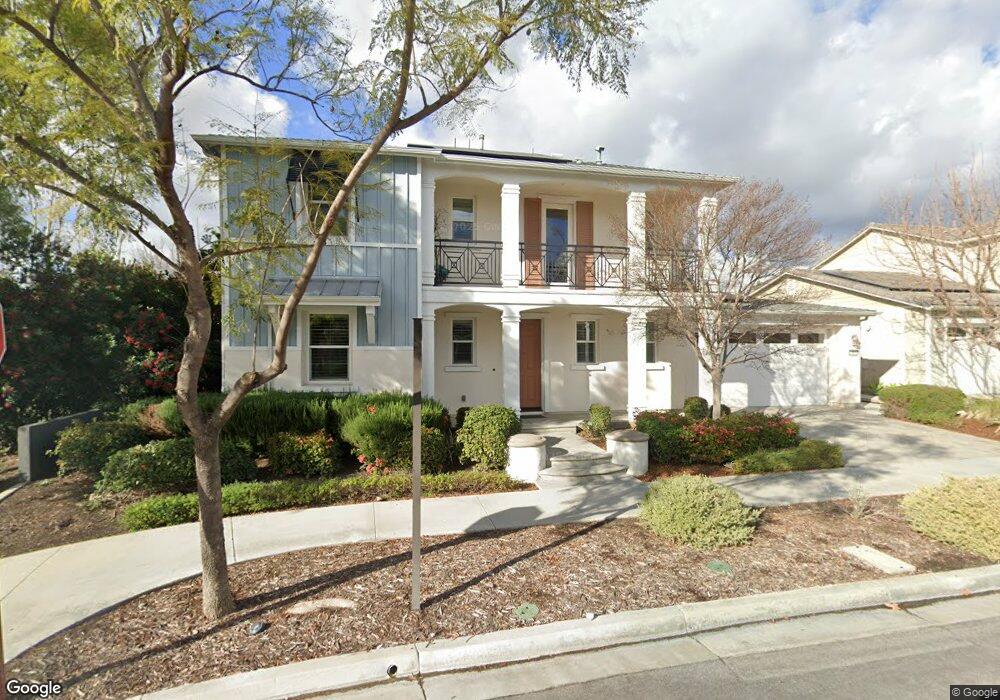
141 Smallwheel Irvine, CA 92618
Great Park NeighborhoodEstimated Value: $2,685,000 - $2,888,000
5
Beds
6
Baths
3,250
Sq Ft
$850/Sq Ft
Est. Value
About This Home
This home is located at 141 Smallwheel, Irvine, CA 92618 and is currently estimated at $2,761,616, approximately $849 per square foot. 141 Smallwheel is a home with nearby schools including Beacon Park, Portola High School, and Woodbury Elementary School.
Ownership History
Date
Name
Owned For
Owner Type
Purchase Details
Closed on
Sep 12, 2025
Sold by
Song Zikun
Bought by
Song Zikun and He Fengzhi
Current Estimated Value
Purchase Details
Closed on
Feb 2, 2018
Sold by
Luo Haijian
Bought by
Luo Haijina and Song Zikun
Purchase Details
Closed on
Mar 17, 2017
Sold by
Lennar Homes Of California Inc
Bought by
Luo Hadian
Purchase Details
Closed on
Jan 23, 2017
Sold by
Song Shaowen
Bought by
Luo Haijian
Create a Home Valuation Report for This Property
The Home Valuation Report is an in-depth analysis detailing your home's value as well as a comparison with similar homes in the area
Home Values in the Area
Average Home Value in this Area
Purchase History
| Date | Buyer | Sale Price | Title Company |
|---|---|---|---|
| Song Zikun | -- | None Listed On Document | |
| Song Zikun | -- | None Listed On Document | |
| Luo Haijina | -- | None Available | |
| Luo Hadian | $1,585,000 | North American Title | |
| Luo Haijian | -- | North American Title |
Source: Public Records
Tax History
| Year | Tax Paid | Tax Assessment Tax Assessment Total Assessment is a certain percentage of the fair market value that is determined by local assessors to be the total taxable value of land and additions on the property. | Land | Improvement |
|---|---|---|---|---|
| 2025 | $29,511 | $1,839,512 | $1,145,980 | $693,532 |
| 2024 | $29,511 | $1,803,444 | $1,123,510 | $679,934 |
| 2023 | $28,883 | $1,768,083 | $1,101,481 | $666,602 |
| 2022 | $28,372 | $1,733,415 | $1,079,883 | $653,532 |
| 2021 | $27,815 | $1,699,427 | $1,058,709 | $640,718 |
| 2020 | $27,610 | $1,682,002 | $1,047,853 | $634,149 |
| 2019 | $27,180 | $1,649,022 | $1,027,307 | $621,715 |
| 2018 | $26,690 | $1,616,689 | $1,007,164 | $609,525 |
| 2017 | $22,871 | $1,280,866 | $664,075 | $616,791 |
| 2016 | $22,424 | $1,255,751 | $651,053 | $604,698 |
| 2015 | $7,945 | $641,274 | $641,274 | $0 |
Source: Public Records
Map
Nearby Homes
Your Personal Tour Guide
Ask me questions while you tour the home.