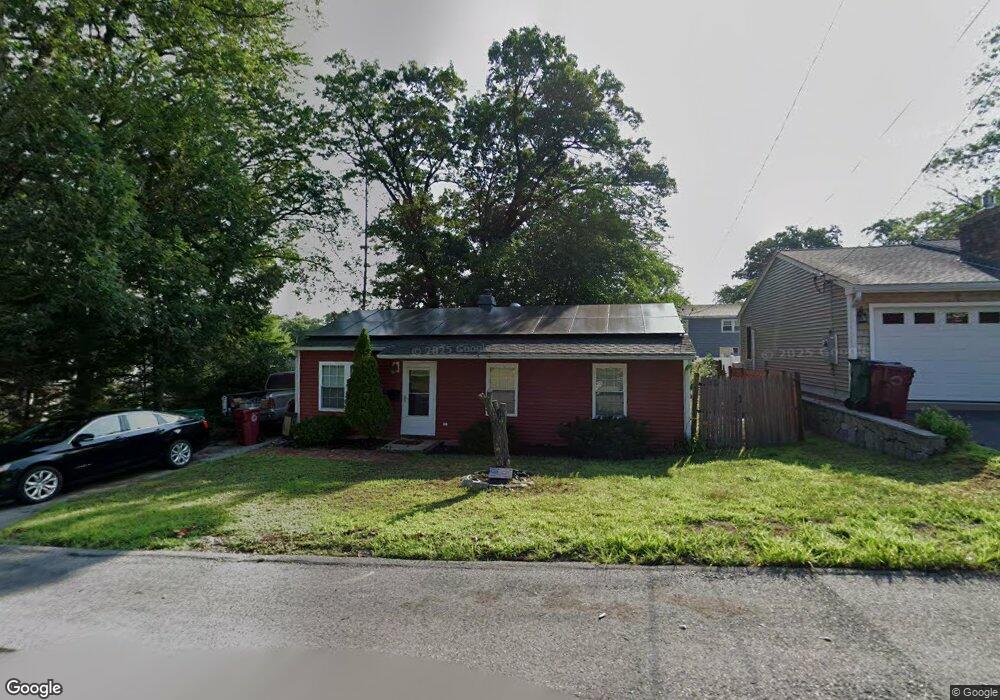
141 Thornton Ave Unit 1 Lowell, MA 01852
Belvidere NeighborhoodEstimated Value: $435,000 - $485,000
2
Beds
1
Bath
925
Sq Ft
$499/Sq Ft
Est. Value
About This Home
This home is located at 141 Thornton Ave Unit 1, Lowell, MA 01852 and is currently estimated at $461,367, approximately $498 per square foot. 141 Thornton Ave Unit 1 is a home located in Middlesex County with nearby schools including Moody Elementary School, Abraham Lincoln Elementary School, and Greenhalge Elementary School.
Ownership History
Date
Name
Owned For
Owner Type
Purchase Details
Closed on
Jul 29, 2016
Sold by
Kevin J Paiva
Bought by
Toro Christopher A
Current Estimated Value
Home Financials for this Owner
Home Financials are based on the most recent Mortgage that was taken out on this home.
Original Mortgage
$210,975
Outstanding Balance
$168,333
Interest Rate
3.48%
Estimated Equity
$293,034
Purchase Details
Closed on
Jul 6, 2005
Sold by
Long Judith R
Bought by
Paiva Kevin J
Purchase Details
Closed on
May 27, 2004
Sold by
Grenier James P
Bought by
Long Judith R
Purchase Details
Closed on
Nov 17, 2000
Sold by
Feroleto Patricia A and Feroleto Albert J
Bought by
Grenier James P
Purchase Details
Closed on
Jul 14, 1999
Sold by
Secchiaroli Timothy
Bought by
Decoste Patricia A and Feroleto Albert J
Purchase Details
Closed on
Sep 4, 1997
Sold by
Sweeney Diane B
Bought by
Secchiaroli Timothy
Create a Home Valuation Report for This Property
The Home Valuation Report is an in-depth analysis detailing your home's value as well as a comparison with similar homes in the area
Home Values in the Area
Average Home Value in this Area
Purchase History
| Date | Buyer | Sale Price | Title Company |
|---|---|---|---|
| Toro Christopher A | -- | -- | |
| Paiva Kevin J | $268,000 | -- | |
| Paiva Kevin J | $268,000 | -- | |
| Long Judith R | $205,000 | -- | |
| Long Judith R | $205,000 | -- | |
| Grenier James P | $155,000 | -- | |
| Grenier James P | $155,000 | -- | |
| Decoste Patricia A | $115,900 | -- | |
| Decoste Patricia A | $115,900 | -- | |
| Secchiaroli Timothy | $87,000 | -- | |
| Secchiaroli Timothy | $87,000 | -- |
Source: Public Records
Mortgage History
| Date | Status | Borrower | Loan Amount |
|---|---|---|---|
| Open | Secchiaroli Timothy | $210,975 | |
| Closed | Secchiaroli Timothy | -- |
Source: Public Records
Tax History Compared to Growth
Tax History
| Year | Tax Paid | Tax Assessment Tax Assessment Total Assessment is a certain percentage of the fair market value that is determined by local assessors to be the total taxable value of land and additions on the property. | Land | Improvement |
|---|---|---|---|---|
| 2025 | $4,621 | $402,500 | $184,200 | $218,300 |
| 2024 | $4,375 | $367,300 | $172,100 | $195,200 |
| 2023 | $4,145 | $333,700 | $149,700 | $184,000 |
| 2022 | $3,530 | $278,200 | $131,800 | $146,400 |
| 2021 | $3,401 | $252,700 | $114,600 | $138,100 |
| 2020 | $3,165 | $236,900 | $114,600 | $122,300 |
| 2019 | $3,086 | $219,800 | $109,600 | $110,200 |
| 2018 | $2,941 | $204,400 | $104,400 | $100,000 |
| 2017 | $2,845 | $190,700 | $92,600 | $98,100 |
| 2016 | $2,782 | $183,500 | $88,300 | $95,200 |
| 2015 | $2,802 | $181,000 | $88,300 | $92,700 |
| 2013 | $2,556 | $170,300 | $90,800 | $79,500 |
Source: Public Records
Map
Nearby Homes
- 16 Winding Ln
- 173 Merrimack Meadows Ln Unit 162
- 15 Sharyn Cir
- 78 Merrimack Meadows Ln Unit 78
- 11 Merrimack Meadows Ln Unit 17
- 16 Wetherbee Ave
- 100 Merrimack Ave Unit 50
- 100 Merrimack Ave Unit 91
- 100 Merrimack Ave Unit 124
- 45 Clark Rd
- 173 Brook St
- 820 Methuen St Unit 820
- 26 Luce St
- 45 Luce St
- 111 Draper St
- 11 View St
- 9 Cobleigh Dr
- 931 Methuen St Unit 6
- 251 Clark Rd
- 288 Hovey St
- 141 Thornton Ave
- 135 Thornton Ave
- 138 Virginia Ave
- 149 Thornton Ave
- 127 Thornton Ave
- 142 Thornton Ave
- 148 Virginia Ave
- 130 Virginia Ave
- 156 Thornton Ave
- 121 Thornton Ave
- 139 Virginia Ave
- 126 Thornton Ave
- 145 Virginia Ave
- 205 Trull Ln E
- 131 Virginia Ave
- 195 Trull Ln E
- 165 Thornton Ave
- 151 Virginia Ave
- 158 Virginia Ave
- 215 Trull Ln E