Estimated Value: $536,281 - $722,000
6
Beds
2
Baths
1,450
Sq Ft
$418/Sq Ft
Est. Value
About This Home
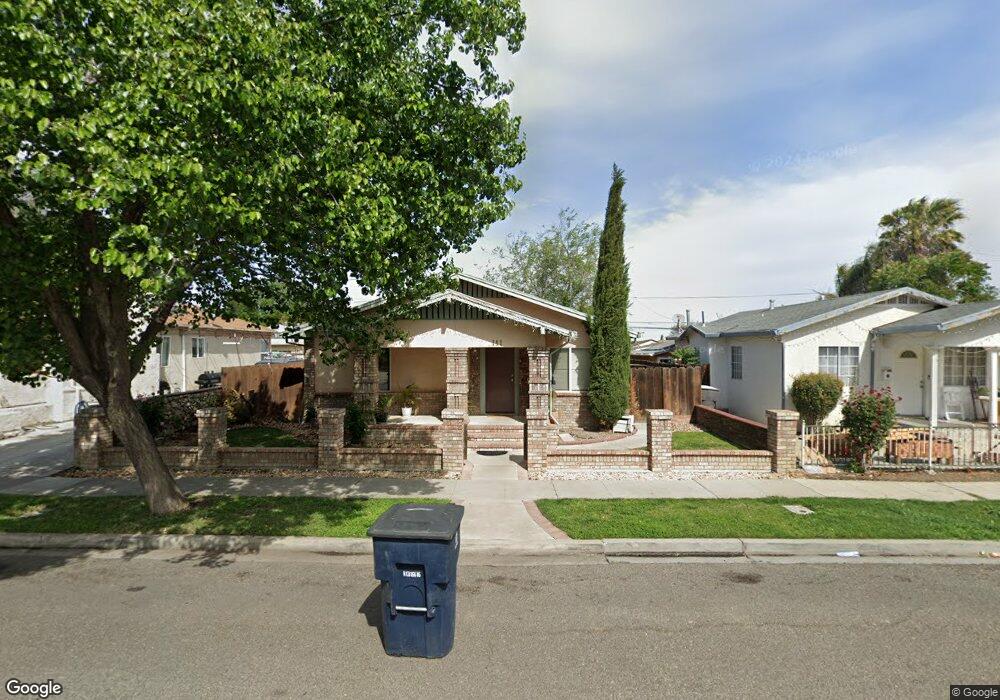
This home is located at 141 W 3rd St, Tracy, CA 95376 and is currently estimated at $606,570, approximately $418 per square foot. 141 W 3rd St is a home located in San Joaquin County with nearby schools including South/West Park Elementary School, Earle E. Williams Middle School, and Tracy High School.
Ownership History
Date
Name
Owned For
Owner Type
Purchase Details
Closed on
Sep 6, 2013
Sold by
Kamboj Sawaran
Bought by
Kamboj Sawaran and The Sawaran Kamboj Separate Pr
Current Estimated Value
Purchase Details
Closed on
Jan 28, 2008
Sold by
Santiago Aurora S
Bought by
Santiago Aurora S and The Aurora S Santiago Trust
Purchase Details
Closed on
Jan 18, 1996
Sold by
Santiago Aurora S
Bought by
Santiago Aurora S
Home Financials for this Owner
Home Financials are based on the most recent Mortgage that was taken out on this home.
Original Mortgage
$112,500
Interest Rate
7%
Create a Home Valuation Report for This Property
The Home Valuation Report is an in-depth analysis detailing your home's value as well as a comparison with similar homes in the area
Home Values in the Area
Average Home Value in this Area
Purchase History
| Date | Buyer | Sale Price | Title Company |
|---|---|---|---|
| Kamboj Sawaran | -- | None Available | |
| Santiago Aurora S | -- | None Available | |
| Santiago Aurora S | -- | Old Republic Title Company |
Source: Public Records
Mortgage History
| Date | Status | Borrower | Loan Amount |
|---|---|---|---|
| Closed | Santiago Aurora S | $112,500 |
Source: Public Records
Tax History
| Year | Tax Paid | Tax Assessment Tax Assessment Total Assessment is a certain percentage of the fair market value that is determined by local assessors to be the total taxable value of land and additions on the property. | Land | Improvement |
|---|---|---|---|---|
| 2025 | $3,266 | $281,937 | $85,806 | $196,131 |
| 2024 | $3,010 | $276,410 | $84,124 | $192,286 |
| 2023 | $2,963 | $270,991 | $82,475 | $188,516 |
| 2022 | $2,903 | $265,678 | $80,858 | $184,820 |
| 2021 | $2,869 | $260,470 | $79,273 | $181,197 |
| 2020 | $2,851 | $257,801 | $78,461 | $179,340 |
| 2019 | $2,806 | $252,747 | $76,923 | $175,824 |
| 2018 | $2,760 | $247,792 | $75,415 | $172,377 |
| 2017 | $2,622 | $242,935 | $73,937 | $168,998 |
| 2016 | $2,654 | $238,172 | $72,487 | $165,685 |
| 2015 | $2,630 | $234,596 | $71,399 | $163,197 |
| 2014 | $2,475 | $230,000 | $70,000 | $160,000 |
Source: Public Records
Map
Nearby Homes
- 213 W South St
- 389 Burlington Dr
- 448 Burlington Dr
- 18 W 8th St
- 110 Loma Prieta Cir
- 605 Natalie Ln
- 920 Taft Ave
- 145 Machado Ct
- 480 Gonzalez St
- 206 W 12th St
- 930 Kapareil Dr
- 1007 Lourence Dr
- 166 Norman Ct
- 1241 Parker Ave Unit 1
- 1243 Parker Ave Unit 2
- 1245 Parker Ave Unit 3
- 1110 Amaretto Dr
- 1120 Gatetree Ct
- 1330 Bessie Ave
- 50 S Hickory Ave
Your Personal Tour Guide
Ask me questions while you tour the home.