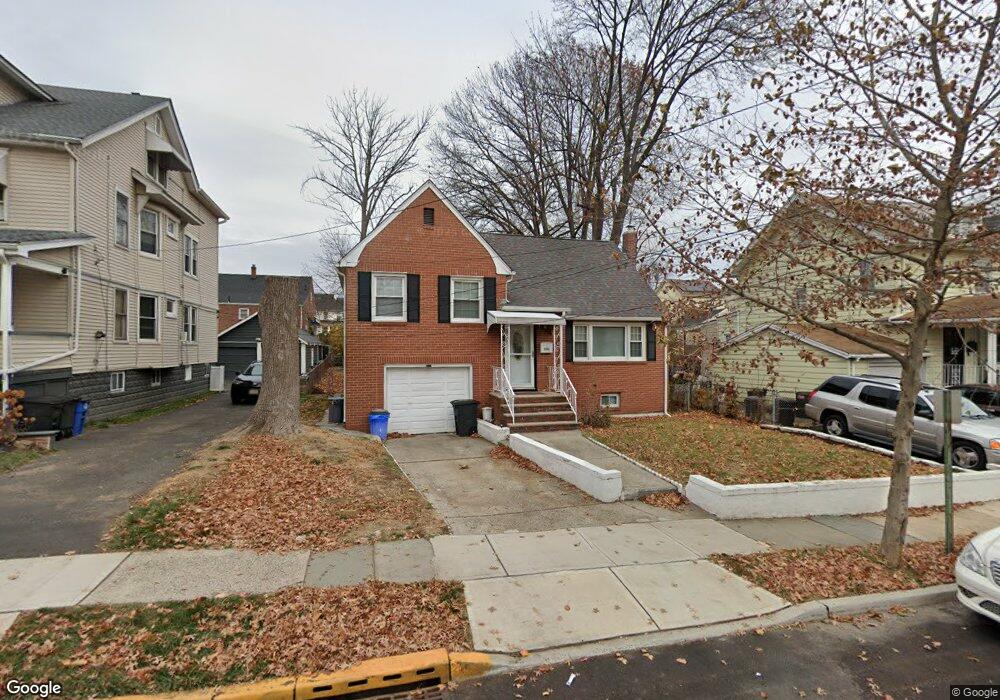
141 Williamson Ave Unit 2 Hillside, NJ 07205
Estimated Value: $451,000 - $536,000
2
Beds
1
Bath
1,100
Sq Ft
$446/Sq Ft
Est. Value
About This Home
This home is located at 141 Williamson Ave Unit 2, Hillside, NJ 07205 and is currently estimated at $490,721, approximately $446 per square foot. 141 Williamson Ave Unit 2 is a home located in Union County with nearby schools including Abram P. Morris-Saybrook Elementary School, Ola Edwards Community School, and Hurden Looker School.
Ownership History
Date
Name
Owned For
Owner Type
Purchase Details
Closed on
Aug 13, 2019
Sold by
Knox Jeffrey and Knox Talina
Bought by
Rogers Dion E
Current Estimated Value
Home Financials for this Owner
Home Financials are based on the most recent Mortgage that was taken out on this home.
Original Mortgage
$232,707
Outstanding Balance
$207,030
Interest Rate
4.5%
Mortgage Type
FHA
Estimated Equity
$283,691
Purchase Details
Closed on
Jul 12, 2005
Sold by
Coral L Houston Revocablelivin
Bought by
Knox Jeffrey and Knox Talina
Home Financials for this Owner
Home Financials are based on the most recent Mortgage that was taken out on this home.
Original Mortgage
$247,500
Interest Rate
7.22%
Mortgage Type
Adjustable Rate Mortgage/ARM
Purchase Details
Closed on
May 19, 1998
Sold by
Houston Coral
Bought by
Houston Coral L
Create a Home Valuation Report for This Property
The Home Valuation Report is an in-depth analysis detailing your home's value as well as a comparison with similar homes in the area
Home Values in the Area
Average Home Value in this Area
Purchase History
| Date | Buyer | Sale Price | Title Company |
|---|---|---|---|
| Rogers Dion E | $237,000 | Multiple | |
| Knox Jeffrey | $275,000 | -- | |
| Houston Coral L | -- | -- |
Source: Public Records
Mortgage History
| Date | Status | Borrower | Loan Amount |
|---|---|---|---|
| Open | Rogers Dion E | $232,707 | |
| Previous Owner | Knox Jeffrey | $247,500 |
Source: Public Records
Tax History
| Year | Tax Paid | Tax Assessment Tax Assessment Total Assessment is a certain percentage of the fair market value that is determined by local assessors to be the total taxable value of land and additions on the property. | Land | Improvement |
|---|---|---|---|---|
| 2025 | $8,294 | $100,500 | $53,400 | $47,100 |
| 2024 | $8,053 | $100,500 | $53,400 | $47,100 |
| 2023 | $8,053 | $100,500 | $53,400 | $47,100 |
| 2022 | $7,979 | $100,500 | $53,400 | $47,100 |
| 2021 | $7,926 | $100,500 | $53,400 | $47,100 |
| 2020 | $7,880 | $100,500 | $53,400 | $47,100 |
| 2019 | $7,727 | $100,500 | $53,400 | $47,100 |
| 2018 | $7,650 | $100,500 | $53,400 | $47,100 |
| 2017 | $7,604 | $100,500 | $53,400 | $47,100 |
| 2016 | $7,595 | $100,500 | $53,400 | $47,100 |
| 2015 | $7,527 | $100,500 | $53,400 | $47,100 |
| 2014 | $7,409 | $100,500 | $53,400 | $47,100 |
Source: Public Records
Map
Nearby Homes
- 1504 Munn Ave
- 95 Keer Ave
- 91 Keer Ave Unit 95
- 151 Keer Ave
- 61-63 Keer Ave
- 61 Keer Ave Unit 63
- 1444 N Broad St
- 1570-72 Clinton Place
- 86-88 Chancellor Ave
- 86 88chancellor Ave
- 75 Hillside Ave
- 183 Chancellor Ave
- 75-81 Chancellor Ave
- 1437 Parkview Terrace
- 1167 Bergen St Unit 1169
- 124 Vassar Ave
- 236-238 Keer Ave
- 261 Winans Ave
- 1431 Compton Terrace
- 252 Keer Ave
- 141 Williamson Ave
- 145 Williamson Ave
- 137 Williamson Ave
- 133 Williamson Ave
- 140 Bailey Ave
- 142 Bailey Ave
- 132 Bailey Ave
- 129 Williamson Ave
- 153 Williamson Ave
- 149 Williamson Ave
- 134 Williamson Ave
- 142 Williamson Ave
- 128 Bailey Ave
- 128 Bailey Ave Unit 1
- 144 Bailey Ave
- 136 Williamson Ave
- 150 Bailey Ave
- 125 Williamson Ave
- 157 Williamson Ave
- 124 Bailey Ave
Your Personal Tour Guide
Ask me questions while you tour the home.