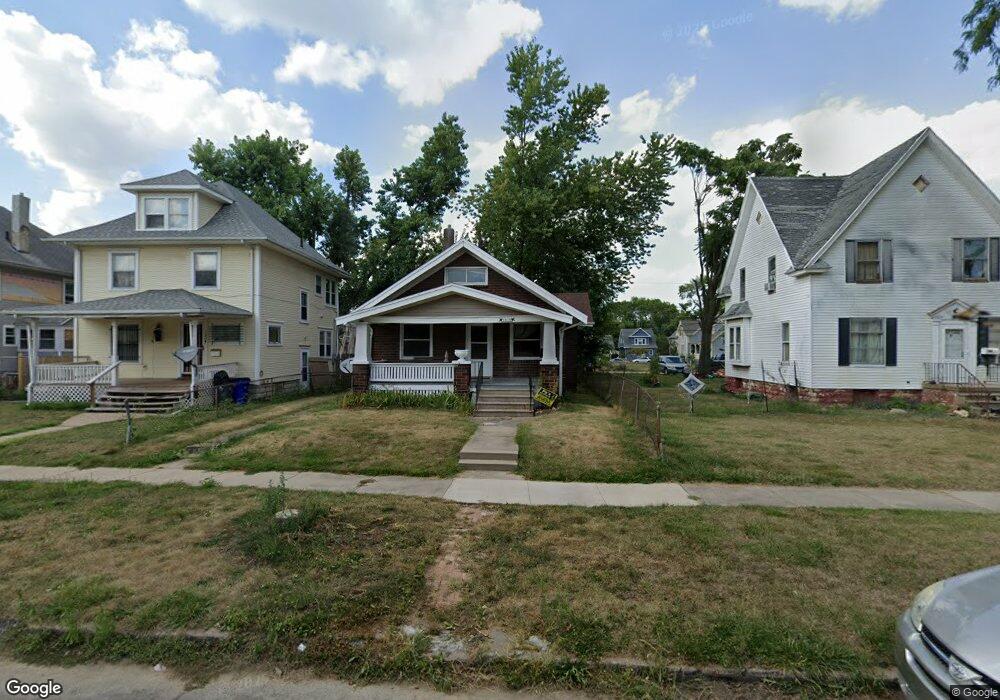
1410 6th Ave SE Cedar Rapids, IA 52403
Wellington Heights NeighborhoodEstimated Value: $120,000 - $127,349
2
Beds
2
Baths
1,200
Sq Ft
$102/Sq Ft
Est. Value
About This Home
This home is located at 1410 6th Ave SE, Cedar Rapids, IA 52403 and is currently estimated at $122,837, approximately $102 per square foot. 1410 6th Ave SE is a home located in Linn County with nearby schools including Johnson STEAM Academy, McKinley STEAM Academy, and Boyd County High School.
Ownership History
Date
Name
Owned For
Owner Type
Purchase Details
Closed on
Feb 26, 2022
Sold by
Bloom Ann M
Bought by
Ann M Bloom Revocable Trust and Bloom
Current Estimated Value
Home Financials for this Owner
Home Financials are based on the most recent Mortgage that was taken out on this home.
Original Mortgage
$56,000
Interest Rate
3.92%
Mortgage Type
Balloon
Purchase Details
Closed on
Apr 21, 2020
Sold by
Bloom Ann M
Bought by
Bloom Ann M and Ann M Bloom Revocable Trust
Home Financials for this Owner
Home Financials are based on the most recent Mortgage that was taken out on this home.
Original Mortgage
$13,300
Interest Rate
3.5%
Mortgage Type
Stand Alone Second
Purchase Details
Closed on
May 14, 1998
Sold by
Hiawatha Carpet Company Inc
Bought by
Bloom Ann M
Home Financials for this Owner
Home Financials are based on the most recent Mortgage that was taken out on this home.
Original Mortgage
$43,500
Interest Rate
7.19%
Create a Home Valuation Report for This Property
The Home Valuation Report is an in-depth analysis detailing your home's value as well as a comparison with similar homes in the area
Home Values in the Area
Average Home Value in this Area
Purchase History
| Date | Buyer | Sale Price | Title Company |
|---|---|---|---|
| Ann M Bloom Revocable Trust | -- | None Listed On Document | |
| Bloom Ann M | -- | Hoag Dean | |
| Ann M Bloom Revocable Trust | -- | None Listed On Document | |
| Bloom Ann M | -- | None Available | |
| Bloom Ann M | $56,000 | -- |
Source: Public Records
Mortgage History
| Date | Status | Borrower | Loan Amount |
|---|---|---|---|
| Previous Owner | Ann M Bloom Revocable Trust | $56,000 | |
| Previous Owner | Bloom Ann M | $13,300 | |
| Previous Owner | Bloom Ann M | $43,500 |
Source: Public Records
Tax History Compared to Growth
Tax History
| Year | Tax Paid | Tax Assessment Tax Assessment Total Assessment is a certain percentage of the fair market value that is determined by local assessors to be the total taxable value of land and additions on the property. | Land | Improvement |
|---|---|---|---|---|
| 2025 | $1,336 | $108,300 | $25,000 | $83,300 |
| 2024 | $1,470 | $98,800 | $22,000 | $76,800 |
| 2023 | $1,470 | $94,600 | $19,000 | $75,600 |
| 2022 | $1,250 | $82,000 | $19,000 | $63,000 |
| 2021 | $1,256 | $72,700 | $16,000 | $56,700 |
| 2020 | $1,256 | $68,800 | $16,000 | $52,800 |
| 2019 | $1,108 | $63,200 | $14,000 | $49,200 |
| 2018 | $1,072 | $63,200 | $14,000 | $49,200 |
| 2017 | $1,100 | $62,300 | $14,000 | $48,300 |
| 2016 | $1,253 | $62,300 | $14,000 | $48,300 |
| 2015 | $1,241 | $61,622 | $14,000 | $47,622 |
| 2014 | $1,056 | $61,622 | $14,000 | $47,622 |
| 2013 | $1,026 | $61,622 | $14,000 | $47,622 |
Source: Public Records
Map
Nearby Homes
- 1512 6th Ave SE
- 1522 6th Ave SE
- 1442 4th Ave SE
- 1506 8th Ave SE
- 1559 Bever Ave SE
- 421 17th St SE
- 513 17th St SE
- 1249 3rd Ave SE
- 369 15th St SE
- 1416 3rd Ave SE
- 809 17th St SE
- 1519 Park Ave SE
- 1741 4th Ave SE
- 414 18th St SE
- 1514 3rd Ave SE
- 356 16th St SE
- 1815 5th Ave SE
- 1517 2nd Ave SE
- 826 Wellington St SE
- 1815 Washington Ave SE
- 1406 6th Ave SE
- 1416 6th Ave SE
- 520 14th St SE
- 1420 6th Ave SE
- 516 14th St SE
- 512 14th St SE
- 1424 6th Ave SE
- 1415 5th Ave SE
- 510 14th St SE
- 1409 5th Ave SE
- 1428 6th Ave SE
- 1405 6th Ave SE
- 1425 5th Ave SE
- 517 15th St SE
- 1401 6th Ave SE
- 1409 6th Ave SE
- 1417 5th Ave SE
- 1403 5th Ave SE
- 1407 6th Ave SE
- 1432 6th Ave SE