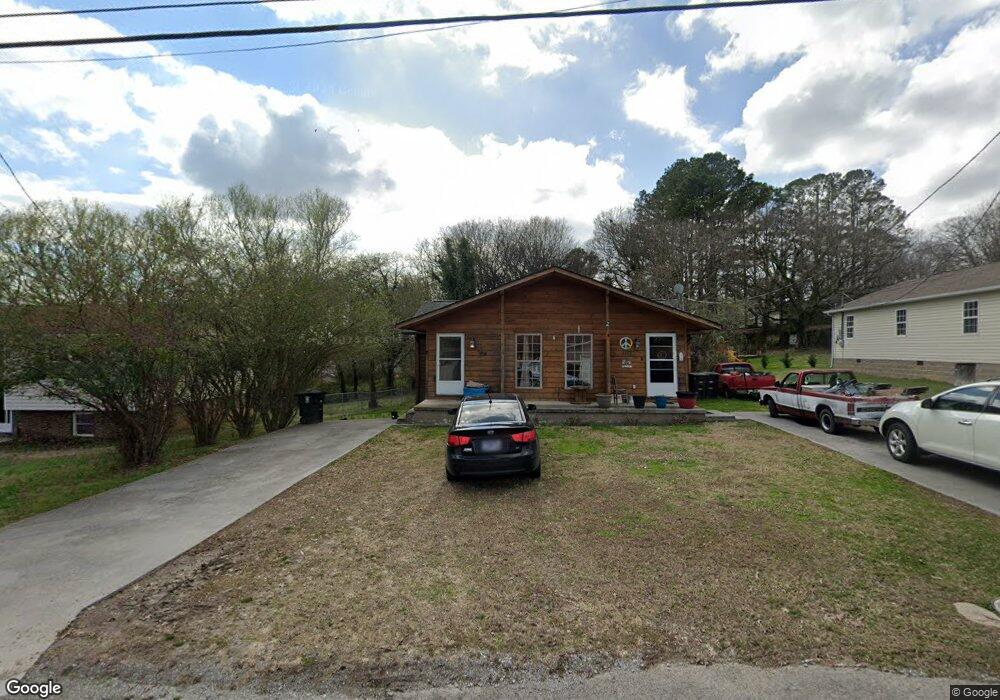
1410 Richardson St Athens, TN 37303
Estimated Value: $185,710 - $305,000
--
Bed
2
Baths
1,520
Sq Ft
$158/Sq Ft
Est. Value
About This Home
This home is located at 1410 Richardson St, Athens, TN 37303 and is currently estimated at $240,428, approximately $158 per square foot. 1410 Richardson St is a home located in McMinn County with nearby schools including Ingleside Elementary School, City Park Elementary School, and Westside Elementary School.
Ownership History
Date
Name
Owned For
Owner Type
Purchase Details
Closed on
Oct 3, 2018
Sold by
Miller Mitchell S
Bought by
Harris Todd
Current Estimated Value
Home Financials for this Owner
Home Financials are based on the most recent Mortgage that was taken out on this home.
Original Mortgage
$85,000
Outstanding Balance
$63,723
Interest Rate
4.5%
Mortgage Type
New Conventional
Estimated Equity
$176,705
Purchase Details
Closed on
Jul 22, 2014
Sold by
Miller Johnny D
Bought by
Miller Mitchell S and Miller Marla L
Purchase Details
Closed on
May 1, 1990
Bought by
Miller Johnny D and Miller John C
Purchase Details
Closed on
Jan 8, 1990
Bought by
Nelson Jerry E and Nelson Hazel
Purchase Details
Closed on
Feb 13, 1989
Bought by
Fritts James Benny Ray and Connie Fra
Purchase Details
Closed on
Mar 14, 1988
Bought by
Andrews Charles and Andrews Lois
Create a Home Valuation Report for This Property
The Home Valuation Report is an in-depth analysis detailing your home's value as well as a comparison with similar homes in the area
Home Values in the Area
Average Home Value in this Area
Purchase History
| Date | Buyer | Sale Price | Title Company |
|---|---|---|---|
| Harris Todd | $100,000 | -- | |
| Miller Mitchell S | $85,000 | -- | |
| Miller Johnny D | $4,000 | -- | |
| Nelson Jerry E | $2,500 | -- | |
| Fritts James Benny Ray | $20,000 | -- | |
| Andrews Charles | -- | -- |
Source: Public Records
Mortgage History
| Date | Status | Borrower | Loan Amount |
|---|---|---|---|
| Open | Harris Todd | $85,000 |
Source: Public Records
Tax History Compared to Growth
Tax History
| Year | Tax Paid | Tax Assessment Tax Assessment Total Assessment is a certain percentage of the fair market value that is determined by local assessors to be the total taxable value of land and additions on the property. | Land | Improvement |
|---|---|---|---|---|
| 2024 | $1,240 | $59,360 | $7,800 | $51,560 |
| 2023 | $1,240 | $59,360 | $7,800 | $51,560 |
| 2022 | $1,116 | $38,560 | $6,320 | $32,240 |
| 2021 | $1,116 | $38,560 | $6,320 | $32,240 |
| 2020 | $1,085 | $38,560 | $6,320 | $32,240 |
| 2019 | $1,085 | $38,560 | $6,320 | $32,240 |
| 2018 | $1,085 | $38,560 | $6,320 | $32,240 |
| 2017 | $979 | $32,840 | $3,920 | $28,920 |
| 2016 | $979 | $32,840 | $3,920 | $28,920 |
| 2015 | -- | $32,840 | $3,920 | $28,920 |
| 2014 | $903 | $32,854 | $0 | $0 |
Source: Public Records
Map
Nearby Homes
- 1410 Richardson St Unit 1412
- 1406 Richardson St
- 1414 Richardson St
- 1414 Richardson St Unit Same
- LOT 12 Richardson St
- LOT 10 Richardson St
- 1402 Richardson St
- 1407 Richardson St
- 1418 Richardson St
- 500 Oak St
- 1415 Richardson St
- 508 Oak St
- 504 Oak St
- 611 Haley St
- 0 Oak St
- 1419 Richardson St
- Richeson Dr Oak Hills Subdivision
- 412 Oak St
- 514 Oak St
- 1502 Richardson St Unit 1502 Richardson Stre