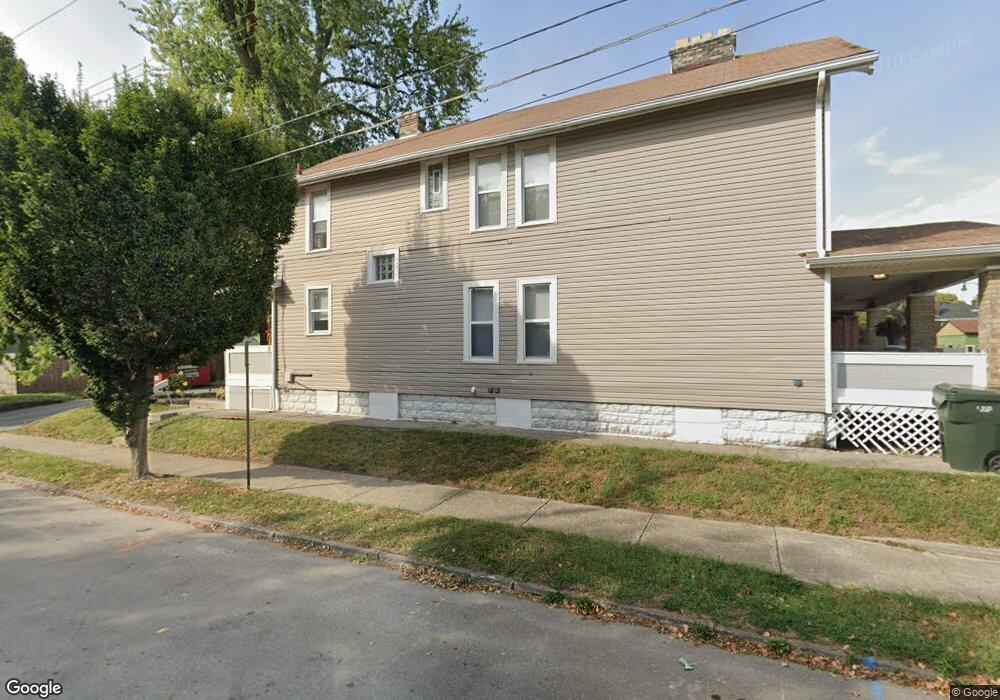
1411 S 4th St Unit TWENTY Columbus, OH 43207
Merion Village NeighborhoodEstimated Value: $212,000 - $236,000
3
Beds
1
Bath
1,160
Sq Ft
$191/Sq Ft
Est. Value
About This Home
This home is located at 1411 S 4th St Unit TWENTY, Columbus, OH 43207 and is currently estimated at $221,490, approximately $190 per square foot. 1411 S 4th St Unit TWENTY is a home located in Franklin County with nearby schools including Southwood Elementary School, South High School, and South Columbus Preparatory Academy.
Ownership History
Date
Name
Owned For
Owner Type
Purchase Details
Closed on
Dec 20, 2024
Sold by
Degutierrez Rosa I Magana and De Gutierrez Roja
Bought by
Kitts Amy J
Current Estimated Value
Home Financials for this Owner
Home Financials are based on the most recent Mortgage that was taken out on this home.
Original Mortgage
$10,649
Outstanding Balance
$10,592
Interest Rate
8.1%
Estimated Equity
$210,898
Purchase Details
Closed on
Dec 13, 2022
Sold by
King Lucy Mae
Bought by
Degutierrez Roja I Magana
Purchase Details
Closed on
Jun 17, 1998
Sold by
Hud
Bought by
King Lucy Mae
Home Financials for this Owner
Home Financials are based on the most recent Mortgage that was taken out on this home.
Original Mortgage
$49,500
Interest Rate
7.03%
Purchase Details
Closed on
Aug 5, 1996
Sold by
Day Isaac
Bought by
Hud
Purchase Details
Closed on
Feb 23, 1994
Create a Home Valuation Report for This Property
The Home Valuation Report is an in-depth analysis detailing your home's value as well as a comparison with similar homes in the area
Home Values in the Area
Average Home Value in this Area
Purchase History
| Date | Buyer | Sale Price | Title Company |
|---|---|---|---|
| Kitts Amy J | $213,000 | Associates Title | |
| Degutierrez Roja I Magana | $32,000 | World Class Title | |
| King Lucy Mae | -- | -- | |
| Hud | $28,000 | -- | |
| -- | $39,000 | -- |
Source: Public Records
Mortgage History
| Date | Status | Borrower | Loan Amount |
|---|---|---|---|
| Open | Kitts Amy J | $10,649 | |
| Open | Kitts Amy J | $208,679 | |
| Previous Owner | King Lucy Mae | $49,500 |
Source: Public Records
Tax History Compared to Growth
Tax History
| Year | Tax Paid | Tax Assessment Tax Assessment Total Assessment is a certain percentage of the fair market value that is determined by local assessors to be the total taxable value of land and additions on the property. | Land | Improvement |
|---|---|---|---|---|
| 2024 | $2,696 | $35,180 | $5,530 | $29,650 |
| 2023 | $1,592 | $35,180 | $5,530 | $29,650 |
| 2022 | $363 | $6,370 | $2,520 | $3,850 |
| 2021 | $339 | $6,370 | $2,520 | $3,850 |
| 2020 | $340 | $6,370 | $2,520 | $3,850 |
| 2019 | $481 | $5,320 | $2,100 | $3,220 |
| 2018 | $525 | $5,320 | $2,100 | $3,220 |
| 2017 | $353 | $5,320 | $2,100 | $3,220 |
| 2016 | $376 | $5,530 | $2,520 | $3,010 |
| 2015 | $719 | $5,530 | $2,520 | $3,010 |
| 2014 | $343 | $5,530 | $2,520 | $3,010 |
| 2013 | $188 | $6,160 | $2,800 | $3,360 |
Source: Public Records
Map
Nearby Homes
- 1366 S 4th St
- 1357 City Park Ave Unit 359
- 1420 S 4th St
- 65 Frebis Ave
- 1374 S 5th St
- 1452 S 4th St
- 165 Frebis Ave
- 1272 S 4th St
- 164 Frebis Ave
- 1264 S High St
- 1437 S High St Unit 439
- 6 Hanford St Unit 6
- 58 W Neff Ave
- 73-75 E Markison Ave
- 1534 S 4th St Unit 1536
- 130 E Gates St
- 154-156 E Gates St
- 1543 S 4th St Unit 1543
- 1542 S 4th St Unit 1542
- 109 E Mithoff St
- 1409-1411 S 4th St
- 1409 S 4th St Unit 411
- 1415 S 4th St
- 1415 S 4th St Unit 1417
- 1407 S 4th St
- 1415-1417 S 4th St
- 1405 S 4th St
- 1403 S 4th St
- 76 E Jenkins Ave
- 1397 S 4th St
- 1414 S 4th St
- 1393 S 4th St
- 1391 S 4th St
- 74 E Jenkins Ave
- 1385 S 4th St Columbus
- 1385 S 4th St
- 1408 S 4th St
- 132 E Jenkins Ave
- 1406 S 3rd St
- 1392 S 3rd St