Estimated Value: $257,456 - $337,000
3
Beds
2
Baths
1,326
Sq Ft
$225/Sq Ft
Est. Value
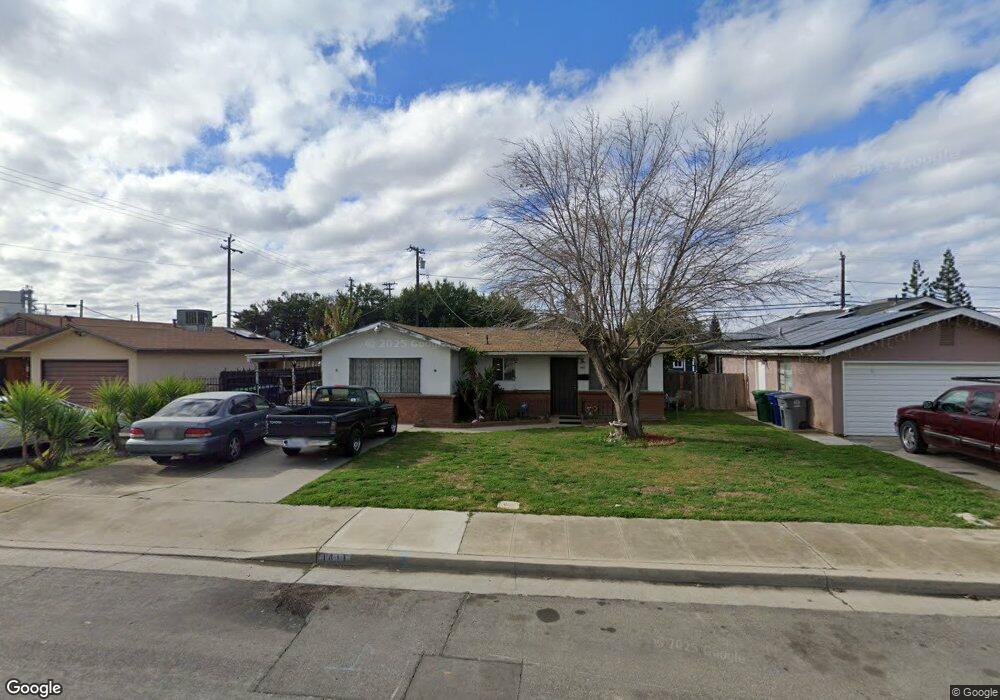
About This Home
This home is located at 1411 Tucker St, Selma, CA 93662 and is currently estimated at $298,485, approximately $225 per square foot. 1411 Tucker St is a home located in Fresno County with nearby schools including Woodrow Wilson Elementary School, Abraham Lincoln Middle School, and Selma High School.
Ownership History
Date
Name
Owned For
Owner Type
Purchase Details
Closed on
Jun 22, 2023
Sold by
Castanon Rosemary
Bought by
Castanon Paul
Current Estimated Value
Purchase Details
Closed on
Jun 16, 2023
Sold by
Castanon Rosemary
Bought by
Castanon Paul
Purchase Details
Closed on
Jun 27, 2019
Sold by
Castanon Rosemary
Bought by
Castanon Paul and Castanon Rosemary
Purchase Details
Closed on
Mar 22, 2006
Sold by
Castanon Connie
Bought by
Castanon Connie
Create a Home Valuation Report for This Property
The Home Valuation Report is an in-depth analysis detailing your home's value as well as a comparison with similar homes in the area
Home Values in the Area
Average Home Value in this Area
Purchase History
| Date | Buyer | Sale Price | Title Company |
|---|---|---|---|
| Castanon Paul | -- | None Listed On Document | |
| Castanon Paul | -- | None Listed On Document | |
| Castanon Paul | -- | None Available | |
| Castanon Rosemary | -- | None Available | |
| Castanon Connie | -- | None Available |
Source: Public Records
Tax History
| Year | Tax Paid | Tax Assessment Tax Assessment Total Assessment is a certain percentage of the fair market value that is determined by local assessors to be the total taxable value of land and additions on the property. | Land | Improvement |
|---|---|---|---|---|
| 2025 | $1,561 | $52,233 | $10,594 | $41,639 |
| 2023 | $1,050 | $50,207 | $10,184 | $40,023 |
| 2022 | $1,433 | $49,224 | $9,985 | $39,239 |
| 2021 | $1,390 | $48,260 | $9,790 | $38,470 |
| 2020 | $1,361 | $47,766 | $9,690 | $38,076 |
| 2019 | $1,311 | $46,830 | $9,500 | $37,330 |
| 2018 | $1,274 | $45,913 | $9,314 | $36,599 |
| 2017 | $1,202 | $45,014 | $9,132 | $35,882 |
| 2016 | $1,098 | $44,132 | $8,953 | $35,179 |
| 2015 | $1,104 | $43,470 | $8,819 | $34,651 |
| 2014 | $1,059 | $42,620 | $8,647 | $33,973 |
Source: Public Records
Map
Nearby Homes
- 1361 Almond St
- 0 Rose Ave
- 1167 Mill St
- 2116 Sylvia St
- 2405 Country Club Ln
- 2022 Bauder St
- 1233 Redwood Ln
- 1517 Stillman St
- 2629 Mccall Ave
- 2482 Country Club Ln
- 2226 Arrants St
- 2772 Valley View St
- 2002 Merced St
- 12623 S Mccall Ave
- 2766 Lee St
- 2221 Floral Ave
- 2510 Whitson St
- 2753 Thompson Ave
- 2561 Stillman St Unit 111
- 2980 Olive St
Your Personal Tour Guide
Ask me questions while you tour the home.