Estimated Value: $275,412 - $303,000
3
Beds
3
Baths
1,670
Sq Ft
$173/Sq Ft
Est. Value
About This Home
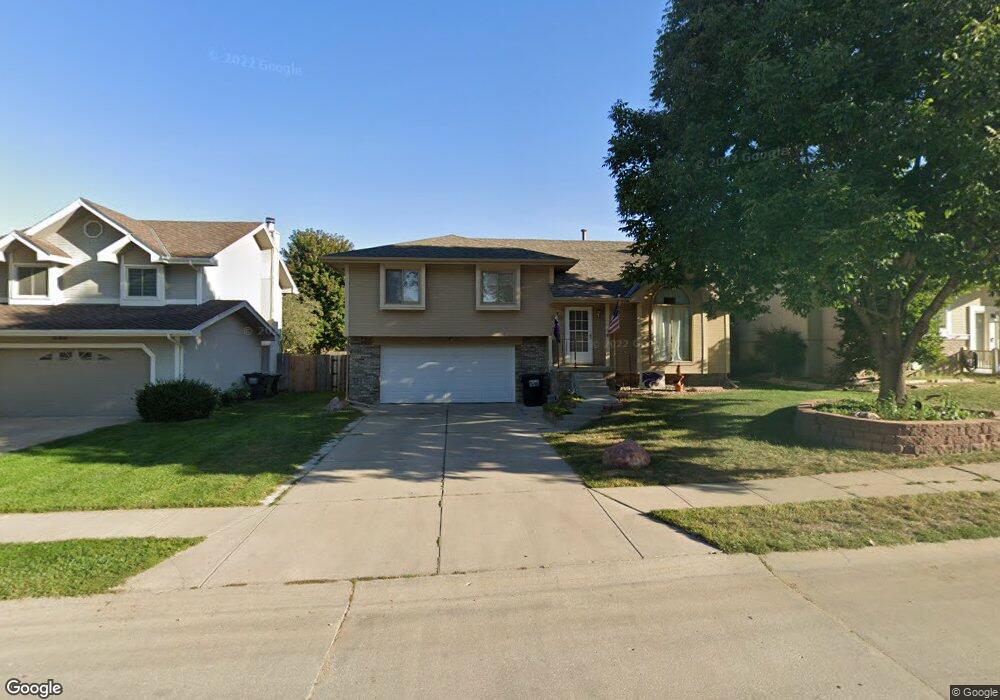
This home is located at 14118 Margo St, Omaha, NE 68138 and is currently estimated at $288,853, approximately $172 per square foot. 14118 Margo St is a home located in Sarpy County with nearby schools including Norman Rockwell Elementary School, Millard South High School, and Millard Central Middle School.
Ownership History
Date
Name
Owned For
Owner Type
Purchase Details
Closed on
Dec 29, 2011
Sold by
Provaznik Richard and Provaznik Jessica
Bought by
Gammer Holdings L L C
Current Estimated Value
Purchase Details
Closed on
Dec 27, 2007
Sold by
Nelson Shawn M and Nelson Christine L
Bought by
Provaznik Richard and Provaznik Jessica
Home Financials for this Owner
Home Financials are based on the most recent Mortgage that was taken out on this home.
Original Mortgage
$109,200
Interest Rate
6.23%
Mortgage Type
Purchase Money Mortgage
Purchase Details
Closed on
Mar 20, 1998
Sold by
Tapp Phillip M and Tapp Carolyn A
Bought by
Nelson Shawn M and Nelson Christine L
Home Financials for this Owner
Home Financials are based on the most recent Mortgage that was taken out on this home.
Original Mortgage
$106,902
Interest Rate
7.04%
Mortgage Type
FHA
Create a Home Valuation Report for This Property
The Home Valuation Report is an in-depth analysis detailing your home's value as well as a comparison with similar homes in the area
Home Values in the Area
Average Home Value in this Area
Purchase History
| Date | Buyer | Sale Price | Title Company |
|---|---|---|---|
| Gammer Holdings L L C | -- | None Available | |
| Provaznik Richard | $137,000 | None Available | |
| Nelson Shawn M | $109,000 | -- |
Source: Public Records
Mortgage History
| Date | Status | Borrower | Loan Amount |
|---|---|---|---|
| Previous Owner | Provaznik Richard | $109,200 | |
| Previous Owner | Nelson Shawn M | $106,902 |
Source: Public Records
Tax History Compared to Growth
Tax History
| Year | Tax Paid | Tax Assessment Tax Assessment Total Assessment is a certain percentage of the fair market value that is determined by local assessors to be the total taxable value of land and additions on the property. | Land | Improvement |
|---|---|---|---|---|
| 2025 | $3,175 | $225,198 | $52,000 | $173,198 |
| 2024 | $3,666 | $216,022 | $46,000 | $170,022 |
| 2023 | $3,666 | $203,295 | $39,000 | $164,295 |
| 2022 | $3,802 | $195,482 | $37,000 | $158,482 |
| 2021 | $3,526 | $176,416 | $35,000 | $141,416 |
| 2020 | $3,142 | $164,595 | $35,000 | $129,595 |
| 2019 | $3,003 | $156,609 | $35,000 | $121,609 |
| 2018 | $2,922 | $148,600 | $28,000 | $120,600 |
| 2017 | $2,781 | $144,028 | $28,000 | $116,028 |
| 2016 | $3,018 | $140,721 | $28,000 | $112,721 |
| 2015 | $2,958 | $137,129 | $28,000 | $109,129 |
| 2014 | $2,782 | $128,612 | $28,000 | $100,612 |
| 2012 | -- | $126,884 | $28,000 | $98,884 |
Source: Public Records
Map
Nearby Homes
- 14020 Margo St
- 7320 S 140th Ave
- 13952 Frederick Cir
- 7110 S 141st St
- 13713 Chandler St
- 13918 Edna St
- 14619 Willow Creek Dr
- 7106 S 145th St
- 14709 Willow Creek Dr
- 13703 Edna St
- 14712 Gertrude St
- 14728 Gertrude St
- 14743 Gertrude St
- 8405 S 142nd Ave
- 8412 S 142nd St
- 15018 Chalco Pointe Cir
- 14910 Edna St
- 8506 S 142nd Ave
- 6610 S 139th St
- 7520 S 135th St
- 14114 Margo St
- 14110 Margo St
- 14119 Lillian Cir
- 14115 Lillian Cir
- 14123 Lillian Cir
- 14117 Margo St
- 14111 Lillian Cir
- 14106 Margo St
- 14121 Margo St
- 14113 Margo St
- 14107 Lillian Cir
- 14105 Margo St
- 14102 Margo St
- 14101 Margo St
- 14103 Lillian Cir
- 14120 Lillian Cir
- 14116 Lillian Cir
- 14124 Lillian Cir
- 14112 Lillian Cir
- 14019 Margo St