1413 1st St Sparks, NV 89431
McCarran Boulevard-Probasco NeighborhoodEstimated Value: $385,000 - $390,000
3
Beds
1
Bath
1,060
Sq Ft
$366/Sq Ft
Est. Value
About This Home
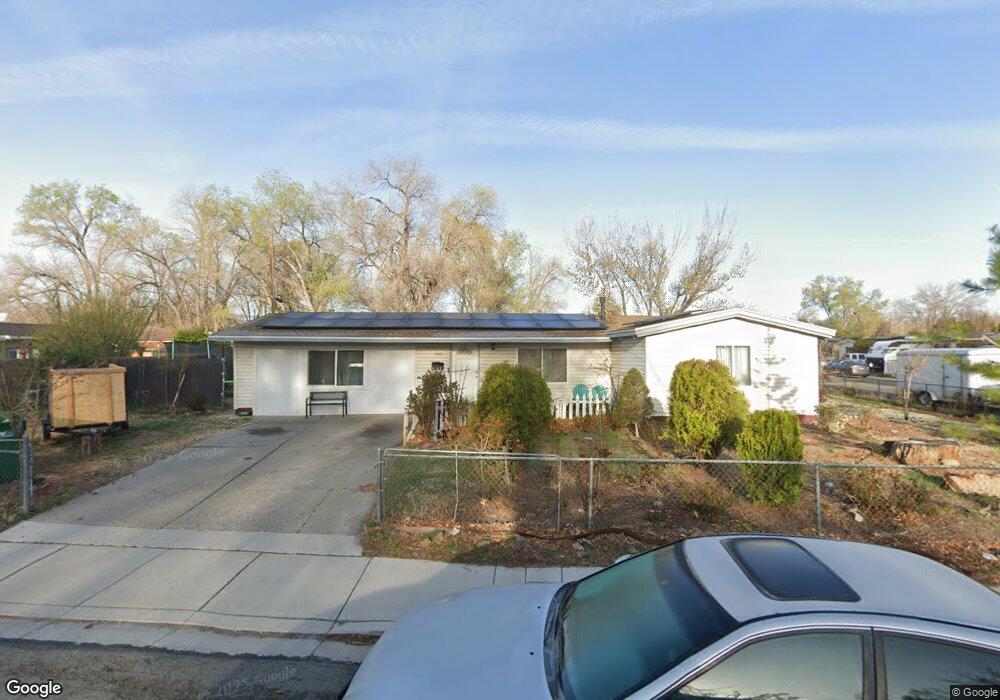
This home is located at 1413 1st St, Sparks, NV 89431 and is currently estimated at $387,568, approximately $365 per square foot. 1413 1st St is a home located in Washoe County with nearby schools including Greenbrae Elementary School, George L Dilworth Middle School, and Sparks High School.
Ownership History
Date
Name
Owned For
Owner Type
Purchase Details
Closed on
Feb 18, 2013
Sold by
Garcia Luis Alberts
Bought by
Garcia Espana Rafael and Melendrez Maria Paz
Current Estimated Value
Purchase Details
Closed on
Jan 3, 2006
Sold by
Rankin Carole
Bought by
Melendrez Garcia Rafael and Melendrez Garcia Maria Paz
Home Financials for this Owner
Home Financials are based on the most recent Mortgage that was taken out on this home.
Original Mortgage
$254,625
Outstanding Balance
$143,542
Interest Rate
6.32%
Mortgage Type
Fannie Mae Freddie Mac
Estimated Equity
$244,026
Purchase Details
Closed on
Apr 29, 1999
Sold by
Talley Robert D and Talley Vera P
Bought by
Rankin Carole
Home Financials for this Owner
Home Financials are based on the most recent Mortgage that was taken out on this home.
Original Mortgage
$104,275
Interest Rate
6.98%
Create a Home Valuation Report for This Property
The Home Valuation Report is an in-depth analysis detailing your home's value as well as a comparison with similar homes in the area
Home Values in the Area
Average Home Value in this Area
Purchase History
| Date | Buyer | Sale Price | Title Company |
|---|---|---|---|
| Garcia Espana Rafael | -- | None Available | |
| Melendrez Garcia Rafael | $262,500 | Western Title Incorporated | |
| Rankin Carole | $107,500 | First Centennial Title Co |
Source: Public Records
Mortgage History
| Date | Status | Borrower | Loan Amount |
|---|---|---|---|
| Open | Melendrez Garcia Rafael | $254,625 | |
| Previous Owner | Rankin Carole | $104,275 |
Source: Public Records
Tax History Compared to Growth
Tax History
| Year | Tax Paid | Tax Assessment Tax Assessment Total Assessment is a certain percentage of the fair market value that is determined by local assessors to be the total taxable value of land and additions on the property. | Land | Improvement |
|---|---|---|---|---|
| 2025 | $668 | $49,740 | $33,565 | $16,175 |
| 2024 | $668 | $46,030 | $30,065 | $15,965 |
| 2023 | $468 | $46,039 | $31,325 | $14,714 |
| 2022 | $630 | $38,188 | $26,180 | $12,009 |
| 2021 | $613 | $29,653 | $17,955 | $11,698 |
| 2020 | $593 | $28,422 | $16,940 | $11,482 |
| 2019 | $576 | $26,756 | $15,890 | $10,866 |
| 2018 | $560 | $22,146 | $11,725 | $10,421 |
| 2017 | $1,221 | $20,634 | $10,395 | $10,239 |
| 2016 | $1,916 | $19,576 | $9,345 | $10,231 |
| 2015 | $530 | $17,876 | $7,700 | $10,176 |
| 2014 | $1,126 | $16,058 | $6,440 | $9,618 |
| 2013 | -- | $13,637 | $4,270 | $9,367 |
Source: Public Records
Map
Nearby Homes
- 1703 1st St
- 8 E O St
- 300 I St
- 1940 4th St Unit 20
- 1940 4th St Unit 51
- 1945 4th St Unit 32
- 1945 4th St Unit 33
- 1945 4th St Unit 10
- 345 H St
- 370 O'Brien Way
- 385 Gleeson Way
- 10 Sheridan Way
- 10 Lincoln Way
- 119 Devere Way
- 3 Strobel Way
- 360 E Lincoln Way
- 1003 Sbragia Way
- 1023 Tyler Way
- 400 4th St
- 848 Parkside Dr Unit 1