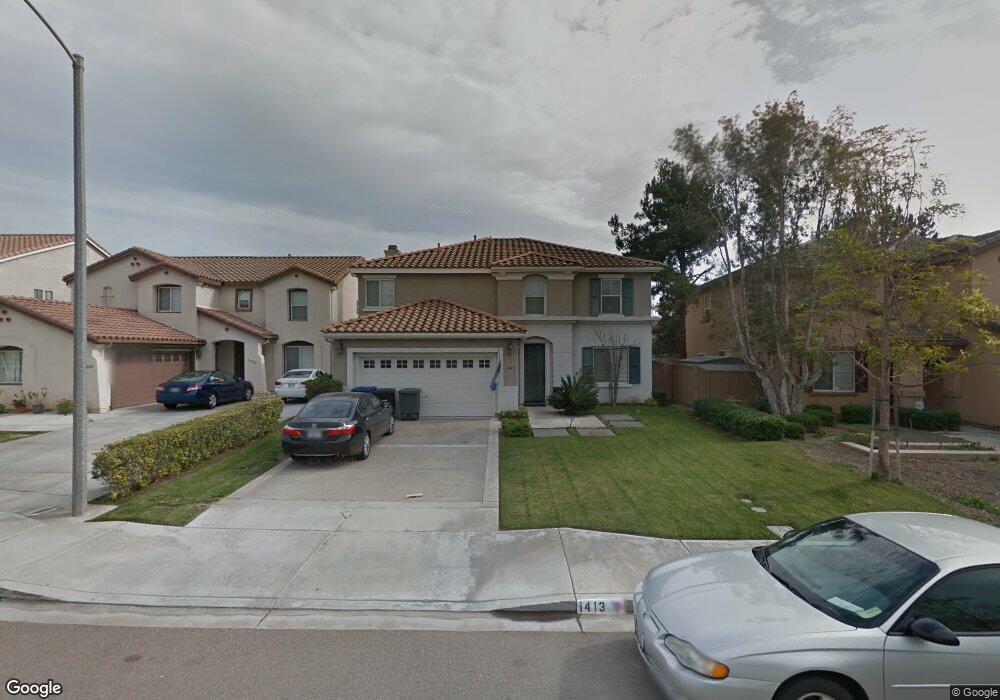
1413 Venters Dr Chula Vista, CA 91911
Estimated Value: $1,036,000 - $1,143,000
4
Beds
3
Baths
2,467
Sq Ft
$442/Sq Ft
Est. Value
About This Home
This home is located at 1413 Venters Dr, Chula Vista, CA 91911 and is currently estimated at $1,090,560, approximately $442 per square foot. 1413 Venters Dr is a home located in San Diego County with nearby schools including Anne & William Hedenkamp Elementary School, Rancho Del Rey Middle School, and Otay Ranch Senior High School.
Ownership History
Date
Name
Owned For
Owner Type
Purchase Details
Closed on
Nov 23, 2010
Sold by
Branek Theresa A
Bought by
Perez Juan M and Perez Claudia
Current Estimated Value
Home Financials for this Owner
Home Financials are based on the most recent Mortgage that was taken out on this home.
Original Mortgage
$346,329
Outstanding Balance
$227,335
Interest Rate
4.17%
Mortgage Type
FHA
Estimated Equity
$863,225
Purchase Details
Closed on
Oct 4, 2002
Sold by
Branek John R
Bought by
Branek Theresa A
Home Financials for this Owner
Home Financials are based on the most recent Mortgage that was taken out on this home.
Original Mortgage
$359,990
Interest Rate
5.8%
Purchase Details
Closed on
Sep 12, 2002
Sold by
Kbone Inc
Bought by
Branek Theresa A
Home Financials for this Owner
Home Financials are based on the most recent Mortgage that was taken out on this home.
Original Mortgage
$359,990
Interest Rate
5.8%
Create a Home Valuation Report for This Property
The Home Valuation Report is an in-depth analysis detailing your home's value as well as a comparison with similar homes in the area
Purchase History
| Date | Buyer | Sale Price | Title Company |
|---|---|---|---|
| Perez Juan M | $381,000 | None Available | |
| Branek Theresa A | -- | First American Title | |
| Branek Theresa A | $450,000 | First American Title |
Source: Public Records
Mortgage History
| Date | Status | Borrower | Loan Amount |
|---|---|---|---|
| Open | Perez Juan M | $346,329 | |
| Previous Owner | Branek Theresa A | $359,990 | |
| Closed | Branek Theresa A | $89,990 |
Source: Public Records
Tax History
| Year | Tax Paid | Tax Assessment Tax Assessment Total Assessment is a certain percentage of the fair market value that is determined by local assessors to be the total taxable value of land and additions on the property. | Land | Improvement |
|---|---|---|---|---|
| 2025 | $8,583 | $543,299 | $196,013 | $347,286 |
| 2024 | $8,583 | $532,647 | $192,170 | $340,477 |
| 2023 | $8,408 | $522,203 | $188,402 | $333,801 |
| 2022 | $8,136 | $511,964 | $184,708 | $327,256 |
| 2021 | $7,380 | $450,946 | $181,087 | $269,859 |
| 2020 | $7,207 | $446,323 | $179,231 | $267,092 |
| 2019 | $7,024 | $437,572 | $175,717 | $261,855 |
| 2018 | $6,891 | $428,993 | $172,272 | $256,721 |
| 2017 | $12 | $420,583 | $168,895 | $251,688 |
| 2016 | $6,571 | $412,337 | $165,584 | $246,753 |
| 2015 | $6,394 | $406,144 | $163,097 | $243,047 |
| 2014 | $6,221 | $398,190 | $159,903 | $238,287 |
Source: Public Records
Map
Nearby Homes
- 788 Callecita Aquilla Sur
- 808 Mateo St Unit 6
- 1233 Equinox Way
- 769 Mateo St Unit 1
- 789 Mateo St Unit 2
- 1519 Taber Dr
- 1512 Concord Way
- 760 Jilian St Unit 1
- 766 Jilian St Unit 2
- 821 Mateo St Unit 1
- 1201 Halley Ct
- 843 Caminito Las Olas
- 1560 Cavern Point Ct
- 1408 Oleander Ave
- 796 Makani St Unit 3
- 664 Rainbow Dr
- 841 Hana Ave Unit 1
- 715 Paso de Luz
- 1539 Sonora Dr Unit 262
- 940 Sullivan Ct
- 1409 Venters Dr
- 1417 Venters Dr
- 1407 Venters Dr
- 1421 Venters Dr
- 1412 Venters Dr
- 1405 Venters Dr
- 1416 Venters Dr
- 1408 Venters Dr
- 1480 Robles Dr
- 1484 Robles Dr
- 1488 Robles Dr
- 1401 Venters Dr Unit 16
- 1476 Robles Dr
- 1492 Robles Dr
- 1424 Venters Dr
- 1404 Venters Dr
- 1496 Robles Dr
- 1472 Robles Dr
- 1400 Venters Dr
- 1431 Venters Dr
Your Personal Tour Guide
Ask me questions while you tour the home.