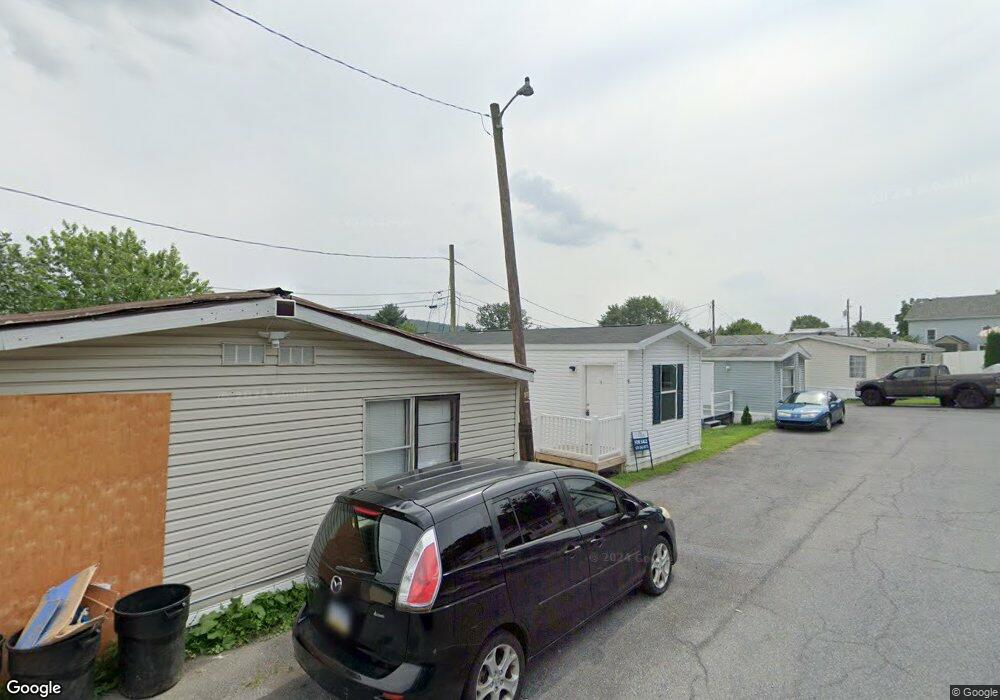
1414 E Susquehanna St Unit Lot 6 Allentown, PA 18103
Southside NeighborhoodEstimated Value: $401,000 - $3,189,356
2
Beds
1
Bath
590
Sq Ft
$2,478/Sq Ft
Est. Value
About This Home
This home is located at 1414 E Susquehanna St Unit Lot 6, Allentown, PA 18103 and is currently estimated at $1,462,119, approximately $2,478 per square foot. 1414 E Susquehanna St Unit Lot 6 is a home located in Lehigh County with nearby schools including Donahoe Elementary School, Dumbarton Elementary School, and Salisbury Elementary School.
Ownership History
Date
Name
Owned For
Owner Type
Purchase Details
Closed on
Mar 30, 2012
Sold by
Suba Property Management Inc
Bought by
Smith Brothers Group Llc
Current Estimated Value
Home Financials for this Owner
Home Financials are based on the most recent Mortgage that was taken out on this home.
Original Mortgage
$320,000
Outstanding Balance
$221,444
Interest Rate
3.95%
Mortgage Type
New Conventional
Estimated Equity
$1,240,675
Purchase Details
Closed on
Mar 3, 2005
Sold by
Angelus Oliver J and Angelus Judy
Bought by
Suba Property Management Inc
Home Financials for this Owner
Home Financials are based on the most recent Mortgage that was taken out on this home.
Original Mortgage
$1,100,000
Interest Rate
5.66%
Mortgage Type
Purchase Money Mortgage
Purchase Details
Closed on
Oct 15, 1975
Bought by
Gilly'S Mobile Home Park
Create a Home Valuation Report for This Property
The Home Valuation Report is an in-depth analysis detailing your home's value as well as a comparison with similar homes in the area
Home Values in the Area
Average Home Value in this Area
Purchase History
| Date | Buyer | Sale Price | Title Company |
|---|---|---|---|
| Smith Brothers Group Llc | $1,500,000 | -- | |
| Suba Property Management Inc | $550,000 | -- | |
| Gilly'S Mobile Home Park | $50,000 | -- |
Source: Public Records
Mortgage History
| Date | Status | Borrower | Loan Amount |
|---|---|---|---|
| Open | Smith Brothers Group Llc | $320,000 | |
| Previous Owner | Suba Property Management Inc | $1,100,000 |
Source: Public Records
Tax History Compared to Growth
Tax History
| Year | Tax Paid | Tax Assessment Tax Assessment Total Assessment is a certain percentage of the fair market value that is determined by local assessors to be the total taxable value of land and additions on the property. | Land | Improvement |
|---|---|---|---|---|
| 2025 | $24,601 | $781,100 | $480,000 | $301,100 |
| 2024 | $23,503 | $781,100 | $480,000 | $301,100 |
| 2023 | $22,296 | $781,100 | $480,000 | $301,100 |
| 2022 | $21,735 | $781,100 | $301,100 | $480,000 |
| 2021 | $20,864 | $781,100 | $480,000 | $301,100 |
| 2020 | $20,052 | $781,100 | $480,000 | $301,100 |
| 2019 | $19,321 | $781,100 | $480,000 | $301,100 |
| 2018 | $18,975 | $781,100 | $480,000 | $301,100 |
| 2017 | $18,492 | $781,100 | $480,000 | $301,100 |
| 2016 | -- | $781,100 | $480,000 | $301,100 |
| 2015 | -- | $781,100 | $480,000 | $301,100 |
| 2014 | -- | $781,100 | $480,000 | $301,100 |
Source: Public Records
Map
Nearby Homes
- 1216 Fretz Ave
- 1350 E Susquehanna St
- 1208 E Susquehanna St
- 1217 Salisbury Rd
- 1239 Voortman Ave
- 1145 Lehigh Ave
- 1105 Loxley Ln
- 1710 Illingsworth St
- 1544 Church Rd
- 1113 E Emmaus Ave
- 803 E Cumberland St Unit 747-805
- 727 E Federal St
- 849 Weil St
- 2212 S Melrose Ave
- 2209 S Melrose Ln
- 514 E Lexington St
- 649 Roosevelt Ave
- 2331 S Filbert St
- 501 Skyline Dr
- 710 Hertzog Ave
- 1414 E Susquehanna St
- 1414 E Susquehanna St Unit 35
- 1215 Fretz Ave
- 1229 Fretz Ave
- 1404 E Susquehanna St
- 1235 Fretz Ave
- 1458 Lehigh Ave
- 1454 Lehigh Ave
- 1428 Lehigh Ave
- 1422 Lehigh Ave
- 1241 Fretz Ave
- 1405 E Susquehanna St
- 1450 Lehigh Ave
- 1416 Lehigh Ave
- 1372 E Susquehanna St
- 1214 Fretz Ave
- 1218 Fretz Ave
- 1328 Pearl St
- 1370 E Susquehanna St
- 1400 Lehigh Ave