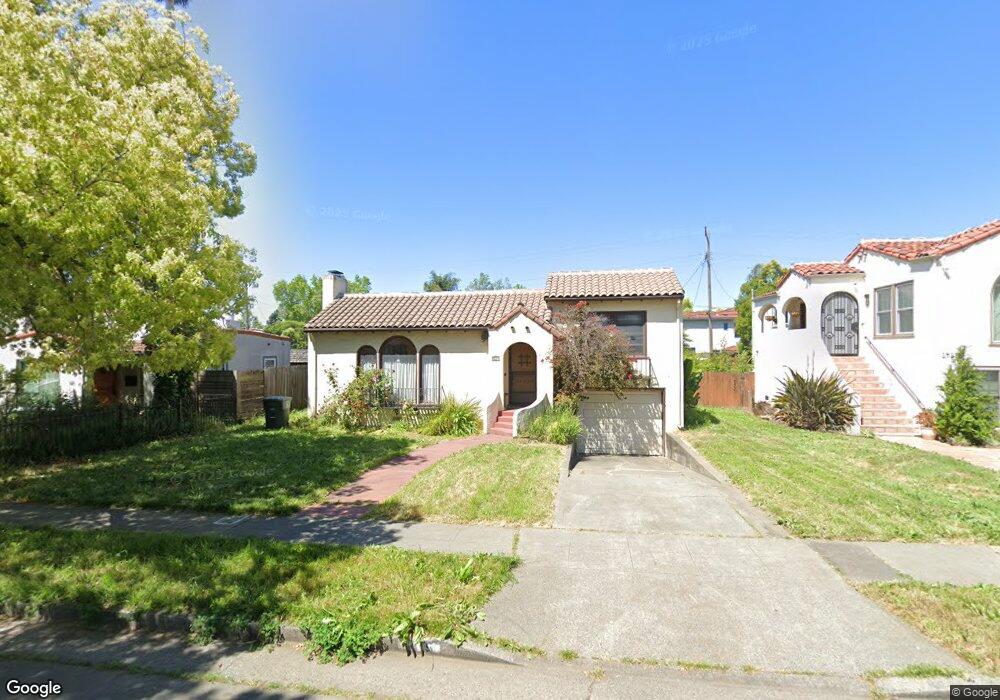
1415 Glenn St Vallejo, CA 94590
West Vallejo NeighborhoodEstimated Value: $518,000 - $558,000
3
Beds
2
Baths
1,416
Sq Ft
$380/Sq Ft
Est. Value
About This Home
This home is located at 1415 Glenn St, Vallejo, CA 94590 and is currently estimated at $538,368, approximately $380 per square foot. 1415 Glenn St is a home located in Solano County with nearby schools including Highland Elementary, Vallejo High School, and Caliber: ChangeMakers Academy.
Ownership History
Date
Name
Owned For
Owner Type
Purchase Details
Closed on
Jan 22, 2019
Sold by
Fuller Elizabeth A
Bought by
Fuller Elizabeth and Fuller Living Trust
Current Estimated Value
Purchase Details
Closed on
Dec 13, 2002
Sold by
Riebli Sean P and Kinavey Jennifer
Bought by
Fuller Elizabeth A
Home Financials for this Owner
Home Financials are based on the most recent Mortgage that was taken out on this home.
Original Mortgage
$248,000
Outstanding Balance
$105,147
Interest Rate
6.06%
Estimated Equity
$433,221
Purchase Details
Closed on
Sep 18, 2000
Sold by
Munter Bernice G
Bought by
Riebli Sean P and Kinavey Jennifer
Home Financials for this Owner
Home Financials are based on the most recent Mortgage that was taken out on this home.
Original Mortgage
$188,000
Interest Rate
8.46%
Purchase Details
Closed on
Sep 10, 1998
Sold by
Munter Alden F
Bought by
Munter Alden F and Munter Bernice G
Create a Home Valuation Report for This Property
The Home Valuation Report is an in-depth analysis detailing your home's value as well as a comparison with similar homes in the area
Home Values in the Area
Average Home Value in this Area
Purchase History
| Date | Buyer | Sale Price | Title Company |
|---|---|---|---|
| Fuller Elizabeth | -- | None Available | |
| Fuller Elizabeth A | $310,000 | North American | |
| Riebli Sean P | $235,000 | Fidelity National Title Co | |
| Munter Alden F | -- | -- |
Source: Public Records
Mortgage History
| Date | Status | Borrower | Loan Amount |
|---|---|---|---|
| Open | Fuller Elizabeth A | $248,000 | |
| Previous Owner | Riebli Sean P | $188,000 | |
| Closed | Fuller Elizabeth A | $14,500 |
Source: Public Records
Tax History
| Year | Tax Paid | Tax Assessment Tax Assessment Total Assessment is a certain percentage of the fair market value that is determined by local assessors to be the total taxable value of land and additions on the property. | Land | Improvement |
|---|---|---|---|---|
| 2025 | $6,115 | $448,971 | $94,136 | $354,835 |
| 2024 | $6,115 | $440,169 | $92,291 | $347,878 |
| 2023 | $6,109 | $431,539 | $90,482 | $341,057 |
| 2022 | $5,715 | $423,078 | $88,708 | $334,370 |
| 2021 | $5,590 | $414,783 | $86,969 | $327,814 |
| 2020 | $5,633 | $402,483 | $84,391 | $318,092 |
| 2019 | $5,479 | $394,592 | $82,737 | $311,855 |
| 2018 | $5,066 | $388,000 | $54,000 | $334,000 |
| 2017 | $4,640 | $361,000 | $54,000 | $307,000 |
| 2016 | $3,869 | $336,000 | $53,000 | $283,000 |
| 2015 | $2,953 | $255,000 | $41,000 | $214,000 |
| 2014 | $2,889 | $248,000 | $42,000 | $206,000 |
Source: Public Records
Map
Nearby Homes
- 17 Hanns Ave
- 15 Monte Vista Ave
- 1322 Alabama St
- 2 El Camino Real
- 327 Arkansas St
- 325 Arkansas St
- 900 Alameda St
- 1038 Alabama St
- 1314 Ohio St
- 1078 Calaveras Way
- 1158 Louisiana St
- 1131 Tennessee St
- 1467 Ohio St
- 135 Bayview Ave
- 1717 Fern Place
- 440 Washington St
- 0 Broadway
- 125 Broadway St
- 323 Hampshire St
- 1636 Ohio St
Your Personal Tour Guide
Ask me questions while you tour the home.