1415 Sandy Stone Ln Cordova, TN 38016
Estimated Value: $231,000 - $263,000
4
Beds
2
Baths
1,739
Sq Ft
$140/Sq Ft
Est. Value
About This Home
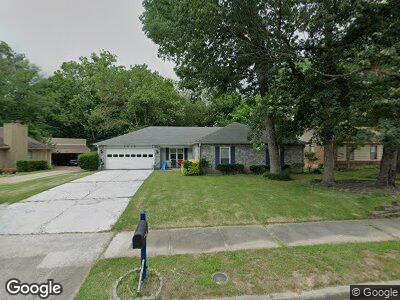
This home is located at 1415 Sandy Stone Ln, Cordova, TN 38016 and is currently estimated at $244,315, approximately $140 per square foot. 1415 Sandy Stone Ln is a home located in Shelby County with nearby schools including Riverwood Elementary School, Cordova Middle School, and Cordova High School.
Ownership History
Date
Name
Owned For
Owner Type
Purchase Details
Closed on
Jun 30, 2011
Sold by
Webb James G
Bought by
Mercado Luis Mario
Current Estimated Value
Home Financials for this Owner
Home Financials are based on the most recent Mortgage that was taken out on this home.
Original Mortgage
$104,287
Outstanding Balance
$72,741
Interest Rate
4.5%
Mortgage Type
FHA
Estimated Equity
$171,574
Purchase Details
Closed on
Jan 23, 2004
Sold by
Wagster Michelle Renee
Bought by
Webb James G
Home Financials for this Owner
Home Financials are based on the most recent Mortgage that was taken out on this home.
Original Mortgage
$96,000
Interest Rate
5.77%
Mortgage Type
Purchase Money Mortgage
Purchase Details
Closed on
Oct 19, 1999
Sold by
Belt Melba L
Bought by
Belt Melba L and Wagster Michelle Renee
Create a Home Valuation Report for This Property
The Home Valuation Report is an in-depth analysis detailing your home's value as well as a comparison with similar homes in the area
Home Values in the Area
Average Home Value in this Area
Purchase History
| Date | Buyer | Sale Price | Title Company |
|---|---|---|---|
| Mercado Luis Mario | $107,000 | Realty Title & Escrow Co Inc | |
| Webb James G | $120,000 | Southern Trust Title Company | |
| Belt Melba L | -- | -- |
Source: Public Records
Mortgage History
| Date | Status | Borrower | Loan Amount |
|---|---|---|---|
| Open | Mercado Luis Mario | $104,287 | |
| Previous Owner | Webb James G | $96,000 |
Source: Public Records
Tax History Compared to Growth
Tax History
| Year | Tax Paid | Tax Assessment Tax Assessment Total Assessment is a certain percentage of the fair market value that is determined by local assessors to be the total taxable value of land and additions on the property. | Land | Improvement |
|---|---|---|---|---|
| 2025 | $1,514 | $57,825 | $12,000 | $45,825 |
| 2024 | $1,514 | $44,675 | $6,500 | $38,175 |
| 2023 | $2,721 | $44,675 | $6,500 | $38,175 |
| 2022 | $2,721 | $44,675 | $6,500 | $38,175 |
| 2021 | $2,753 | $44,675 | $6,500 | $38,175 |
| 2020 | $2,244 | $30,975 | $6,500 | $24,475 |
| 2019 | $2,244 | $30,975 | $6,500 | $24,475 |
| 2018 | $2,244 | $30,975 | $6,500 | $24,475 |
| 2017 | $1,273 | $30,975 | $6,500 | $24,475 |
| 2016 | $1,185 | $27,125 | $0 | $0 |
| 2014 | $1,185 | $27,125 | $0 | $0 |
Source: Public Records
Map
Nearby Homes
- 1427 Sandy Stone Ln
- 1394 Fieldstone Trail
- 7999 Club Center Dr
- 8260 Country Creek Cove
- 8232 River Creek Cove
- 8278 Hardwood Cove
- 8224 Timber Hill Trail
- 8259 Floral Spring Dr
- 1659 Red Barn Dr
- 1538 Beaver Trail Dr
- 1625 Oaken Bucket Dr
- 1474 Lacewing Trace Cove
- 1662 Old Mill Stream
- 1707 Old Mill Stream
- 1623 Barbie St
- 8394 Palm Springs Dr
- 1145 Hunters Lake Dr
- 7792 Fawn Ridge Cove
- 0 Dexter Rd Unit 10177087
- 1601 E Southfield Cir
- 1415 Sandy Stone Ln
- 1421 Sandy Stone Ln
- 1407 Sandy Stone Ln
- 1403 Sandy Stone Ln
- 8129 Broken Rock Cove
- 1435 Sandy Stone Ln
- 1395 Sandy Stone Ln
- 1430 Sandy Stone Ln
- 8133 Broken Rock Cove
- 8116 Creek Way Cove
- 8138 Broken Rock Cove
- 8126 Creek Way Cove
- 8137 Broken Rock Cove
- 1389 Sandy Stone Ln
- 8136 Creek Way Cove
- 1447 Sandy Stone Ln
- 1415 Fieldstone Trail
- 1423 Fieldstone Trail
- 1407 Fieldstone Trail
- 1381 Sandy Stone Ln