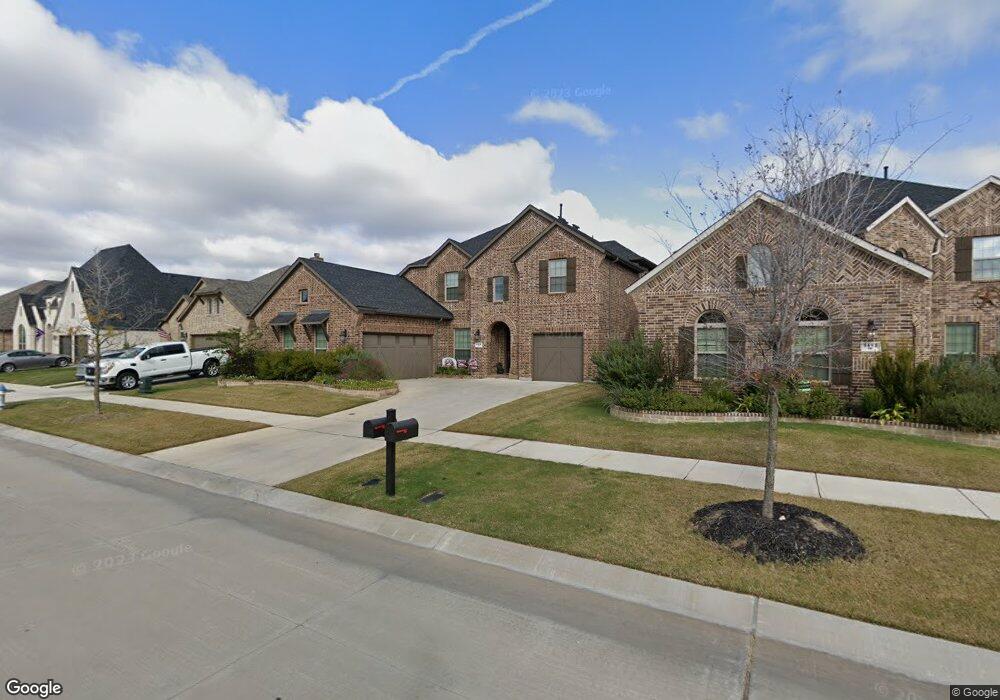
1416 9th St Argyle, TX 76226
Harvest NeighborhoodEstimated Value: $691,000 - $709,534
5
Beds
4
Baths
3,732
Sq Ft
$187/Sq Ft
Est. Value
About This Home
This home is located at 1416 9th St, Argyle, TX 76226 and is currently estimated at $698,634, approximately $187 per square foot. 1416 9th St is a home located in Denton County with nearby schools including Argyle West, Argyle Middle School, and Argyle High School.
Ownership History
Date
Name
Owned For
Owner Type
Purchase Details
Closed on
Apr 28, 2016
Sold by
Mhi Partnership Ltd
Bought by
Saldivar Fidel and Saldivar Jana Mckenzie
Current Estimated Value
Home Financials for this Owner
Home Financials are based on the most recent Mortgage that was taken out on this home.
Original Mortgage
$336,000
Outstanding Balance
$268,088
Interest Rate
3.73%
Mortgage Type
New Conventional
Estimated Equity
$430,546
Create a Home Valuation Report for This Property
The Home Valuation Report is an in-depth analysis detailing your home's value as well as a comparison with similar homes in the area
Home Values in the Area
Average Home Value in this Area
Purchase History
| Date | Buyer | Sale Price | Title Company |
|---|---|---|---|
| Saldivar Fidel | -- | Stewart |
Source: Public Records
Mortgage History
| Date | Status | Borrower | Loan Amount |
|---|---|---|---|
| Open | Saldivar Fidel | $336,000 |
Source: Public Records
Tax History
| Year | Tax Paid | Tax Assessment Tax Assessment Total Assessment is a certain percentage of the fair market value that is determined by local assessors to be the total taxable value of land and additions on the property. | Land | Improvement |
|---|---|---|---|---|
| 2025 | $11,907 | $650,060 | $167,786 | $491,630 |
| 2024 | $12,616 | $590,964 | $0 | $0 |
| 2023 | $10,658 | $537,240 | $108,413 | $602,587 |
| 2022 | $13,521 | $488,400 | $108,413 | $488,558 |
| 2021 | $12,759 | $444,000 | $92,925 | $351,075 |
| 2020 | $13,574 | $453,496 | $92,925 | $360,571 |
| 2019 | $13,986 | $451,073 | $92,925 | $358,148 |
| 2018 | $12,598 | $431,000 | $92,925 | $338,075 |
| 2017 | $12,257 | $420,000 | $92,925 | $327,075 |
| 2016 | $6,052 | $207,370 | $46,463 | $160,907 |
Source: Public Records
Map
Nearby Homes
Your Personal Tour Guide
Ask me questions while you tour the home.