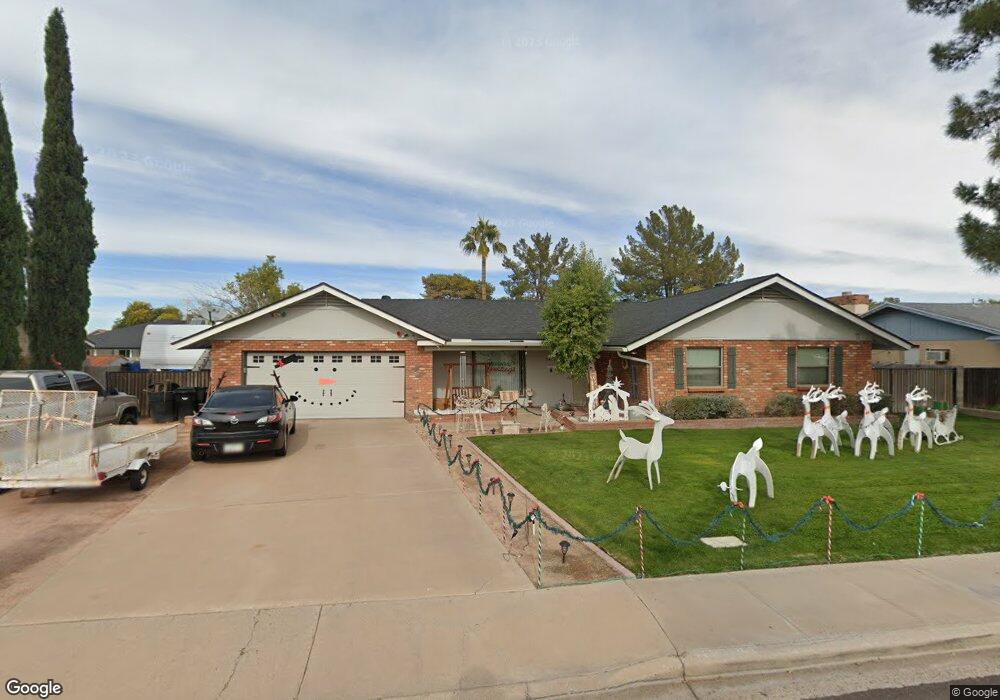
1416 E Kael St Mesa, AZ 85203
North Central Mesa NeighborhoodEstimated Value: $455,394 - $590,000
Studio
3
Baths
1,727
Sq Ft
$289/Sq Ft
Est. Value
About This Home
This home is located at 1416 E Kael St, Mesa, AZ 85203 and is currently estimated at $499,599, approximately $289 per square foot. 1416 E Kael St is a home located in Maricopa County with nearby schools including Macarthur Elementary School, Franklin at Brimhall Elementary School, and Franklin West Elementary School.
Ownership History
Date
Name
Owned For
Owner Type
Purchase Details
Closed on
Aug 24, 2006
Sold by
Diener James G and Diener Stephanie L
Bought by
Diener James G and Diener Stephanie L
Current Estimated Value
Purchase Details
Closed on
Dec 12, 2002
Sold by
Diener James G
Bought by
Diener James G and Diener Stephanie L
Home Financials for this Owner
Home Financials are based on the most recent Mortgage that was taken out on this home.
Original Mortgage
$108,500
Interest Rate
6.03%
Purchase Details
Closed on
Nov 22, 2002
Sold by
Diener Stephanie L
Bought by
Diener James G
Home Financials for this Owner
Home Financials are based on the most recent Mortgage that was taken out on this home.
Original Mortgage
$108,500
Interest Rate
6.03%
Purchase Details
Closed on
Jan 9, 1995
Sold by
Fonger William K and Fonger Tami
Bought by
Diener James G and Diener Stephanie L
Home Financials for this Owner
Home Financials are based on the most recent Mortgage that was taken out on this home.
Original Mortgage
$89,571
Interest Rate
7.25%
Mortgage Type
FHA
Create a Home Valuation Report for This Property
The Home Valuation Report is an in-depth analysis detailing your home's value as well as a comparison with similar homes in the area
Home Values in the Area
Average Home Value in this Area
Purchase History
| Date | Buyer | Sale Price | Title Company |
|---|---|---|---|
| Diener James G | -- | None Available | |
| Diener James G | -- | First Southwestern Title | |
| Diener James G | -- | First Southwestern Title | |
| Diener James G | $100,000 | Stewart Title & Trust |
Source: Public Records
Mortgage History
| Date | Status | Borrower | Loan Amount |
|---|---|---|---|
| Closed | Diener James G | $108,500 | |
| Previous Owner | Diener James G | $89,571 |
Source: Public Records
Tax History
| Year | Tax Paid | Tax Assessment Tax Assessment Total Assessment is a certain percentage of the fair market value that is determined by local assessors to be the total taxable value of land and additions on the property. | Land | Improvement |
|---|---|---|---|---|
| 2025 | $1,520 | $18,306 | -- | -- |
| 2024 | $1,537 | $17,434 | -- | -- |
| 2023 | $1,537 | $37,650 | $7,530 | $30,120 |
| 2022 | $1,503 | $28,170 | $5,630 | $22,540 |
| 2021 | $1,544 | $24,510 | $4,900 | $19,610 |
| 2020 | $1,524 | $22,820 | $4,560 | $18,260 |
| 2019 | $1,412 | $19,820 | $3,960 | $15,860 |
| 2018 | $1,348 | $17,700 | $3,540 | $14,160 |
| 2017 | $1,305 | $18,230 | $3,640 | $14,590 |
| 2016 | $1,282 | $16,150 | $3,230 | $12,920 |
| 2015 | $1,210 | $14,170 | $2,830 | $11,340 |
Source: Public Records
Map
Nearby Homes
- 1443 E Leland St
- 2020 N Hunt Cir
- 1247 E Kenwood St
- 1203 E Kramer Cir
- 1924 N Harris Dr
- 1715 E Kenwood St
- 1708 E Knoll St
- 1335 E June St Unit 239
- 1335 E June St Unit 113
- 1606 E Minton St
- 1762 N Barkley
- 1836 N Stapley Dr Unit 3
- 2438 N Forest Cir
- 1146 E Jensen St
- 1844 E Leland Cir
- 1663 N Doran
- 1657 N Doran
- 1823 E Juniper Cir
- 1920 N Consolidated Canal
- 1714 E Indigo St
- 1410 E Kael St
- 1422 E Kael St
- 1415 E Bates St
- 1405 E Bates St
- 1427 E Bates St
- 1415 E Kael St
- 1411 E Kael St
- 1434 E Kael St
- 1425 E Kael St
- 1437 E Bates St
- 1439 E Kael St
- 2146 N Lazona Dr
- 1418 E Kenwood St
- 1416 E Bates St
- 1365 E Bates St
- 1363 E Bates St
- 1448 E Kael St
- 2132 N Lazona Dr
- 1408 E Kenwood St
- 1428 E Kenwood St
Your Personal Tour Guide
Ask me questions while you tour the home.