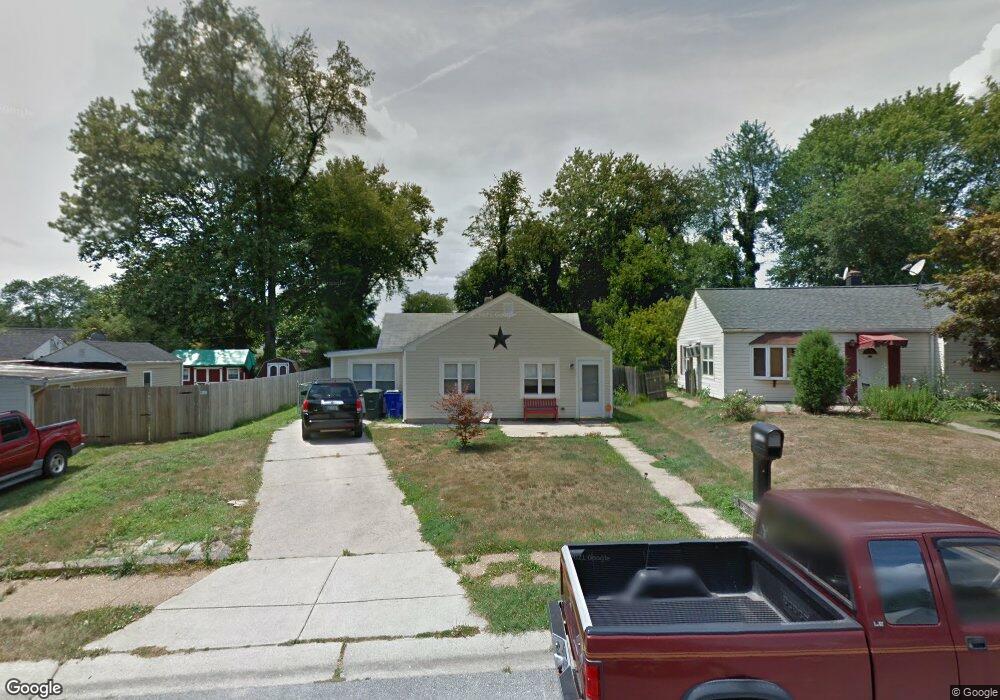
1417 Brook Ln Wilmington, DE 19805
Estimated Value: $270,000 - $305,000
3
Beds
2
Baths
1,225
Sq Ft
$236/Sq Ft
Est. Value
About This Home
This home is located at 1417 Brook Ln, Wilmington, DE 19805 and is currently estimated at $289,589, approximately $236 per square foot. 1417 Brook Ln is a home located in New Castle County with nearby schools including Austin D. Baltz Elementary School, Alexis I. du Pont Middle School, and Thomas McKean High School.
Ownership History
Date
Name
Owned For
Owner Type
Purchase Details
Closed on
Nov 21, 2008
Sold by
Tenth Street Associates Inc
Bought by
Stone Jill P
Current Estimated Value
Home Financials for this Owner
Home Financials are based on the most recent Mortgage that was taken out on this home.
Original Mortgage
$173,025
Outstanding Balance
$113,297
Interest Rate
6.03%
Mortgage Type
FHA
Estimated Equity
$176,292
Purchase Details
Closed on
Nov 5, 2007
Sold by
Tetlow Catherine
Bought by
Us Bank Na
Create a Home Valuation Report for This Property
The Home Valuation Report is an in-depth analysis detailing your home's value as well as a comparison with similar homes in the area
Home Values in the Area
Average Home Value in this Area
Purchase History
| Date | Buyer | Sale Price | Title Company |
|---|---|---|---|
| Stone Jill P | $179,000 | None Available | |
| Us Bank Na | $120,000 | None Available |
Source: Public Records
Mortgage History
| Date | Status | Borrower | Loan Amount |
|---|---|---|---|
| Open | Stone Jill P | $173,025 |
Source: Public Records
Tax History Compared to Growth
Tax History
| Year | Tax Paid | Tax Assessment Tax Assessment Total Assessment is a certain percentage of the fair market value that is determined by local assessors to be the total taxable value of land and additions on the property. | Land | Improvement |
|---|---|---|---|---|
| 2024 | $1,441 | $38,000 | $7,500 | $30,500 |
| 2023 | $1,276 | $38,000 | $7,500 | $30,500 |
| 2022 | $1,284 | $38,000 | $7,500 | $30,500 |
| 2021 | $1,283 | $38,000 | $7,500 | $30,500 |
| 2020 | $1,287 | $38,000 | $7,500 | $30,500 |
| 2019 | $1,374 | $38,000 | $7,500 | $30,500 |
| 2018 | $1,260 | $38,000 | $7,500 | $30,500 |
| 2017 | $1,245 | $38,000 | $7,500 | $30,500 |
| 2016 | $1,189 | $38,000 | $7,500 | $30,500 |
| 2015 | $1,115 | $38,000 | $7,500 | $30,500 |
| 2014 | -- | $38,000 | $7,500 | $30,500 |
Source: Public Records
Map
Nearby Homes