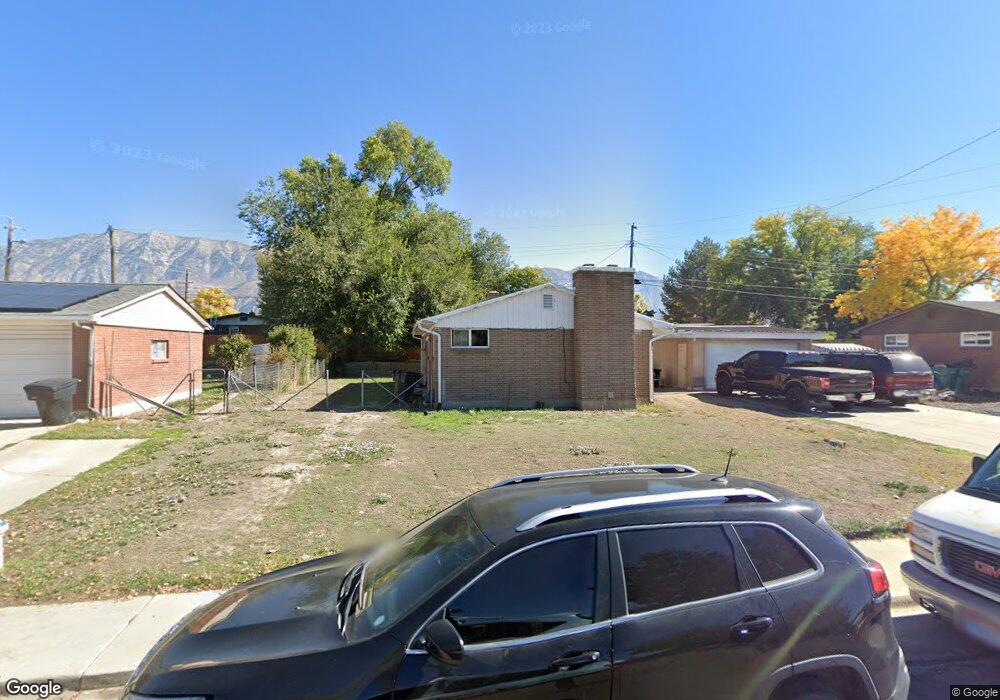
1417 S 200 E Orem, UT 84058
Cherry Hill NeighborhoodEstimated Value: $423,000 - $469,349
4
Beds
2
Baths
1,824
Sq Ft
$241/Sq Ft
Est. Value
About This Home
This home is located at 1417 S 200 E, Orem, UT 84058 and is currently estimated at $439,783, approximately $241 per square foot. 1417 S 200 E is a home located in Utah County with nearby schools including Cherry Hill Elementary School, Lakeridge Jr High School, and Mountain View High School.
Ownership History
Date
Name
Owned For
Owner Type
Purchase Details
Closed on
Apr 14, 2014
Sold by
Hunter Nathan and Hunter Tiffany A
Bought by
Nguyen Duke Cong
Current Estimated Value
Purchase Details
Closed on
Sep 26, 2013
Sold by
Leavitt Leo E and Leavitt Kathryn Myrlene
Bought by
Hunter Nathan and Hunter Tiffany A
Home Financials for this Owner
Home Financials are based on the most recent Mortgage that was taken out on this home.
Original Mortgage
$106,800
Interest Rate
4.49%
Mortgage Type
New Conventional
Create a Home Valuation Report for This Property
The Home Valuation Report is an in-depth analysis detailing your home's value as well as a comparison with similar homes in the area
Home Values in the Area
Average Home Value in this Area
Purchase History
| Date | Buyer | Sale Price | Title Company |
|---|---|---|---|
| Nguyen Duke Cong | -- | Backman Title Services Ltd | |
| Hunter Nathan | -- | Eagle Gate Title Insurance |
Source: Public Records
Mortgage History
| Date | Status | Borrower | Loan Amount |
|---|---|---|---|
| Previous Owner | Hunter Nathan | $106,800 |
Source: Public Records
Tax History
| Year | Tax Paid | Tax Assessment Tax Assessment Total Assessment is a certain percentage of the fair market value that is determined by local assessors to be the total taxable value of land and additions on the property. | Land | Improvement |
|---|---|---|---|---|
| 2025 | $1,840 | $225,225 | -- | -- |
| 2024 | $1,840 | $225,005 | $0 | $0 |
| 2023 | $1,726 | $226,875 | $0 | $0 |
| 2022 | $1,722 | $219,285 | $0 | $0 |
| 2021 | $1,529 | $294,800 | $129,600 | $165,200 |
| 2020 | $1,393 | $264,100 | $103,700 | $160,400 |
| 2019 | $1,191 | $234,700 | $89,800 | $144,900 |
| 2018 | $1,128 | $212,400 | $86,400 | $126,000 |
| 2017 | $1,031 | $104,005 | $0 | $0 |
| 2016 | $972 | $90,420 | $0 | $0 |
| 2015 | $950 | $83,600 | $0 | $0 |
| 2014 | $881 | $77,165 | $0 | $0 |
Source: Public Records
Map
Nearby Homes
Your Personal Tour Guide
Ask me questions while you tour the home.