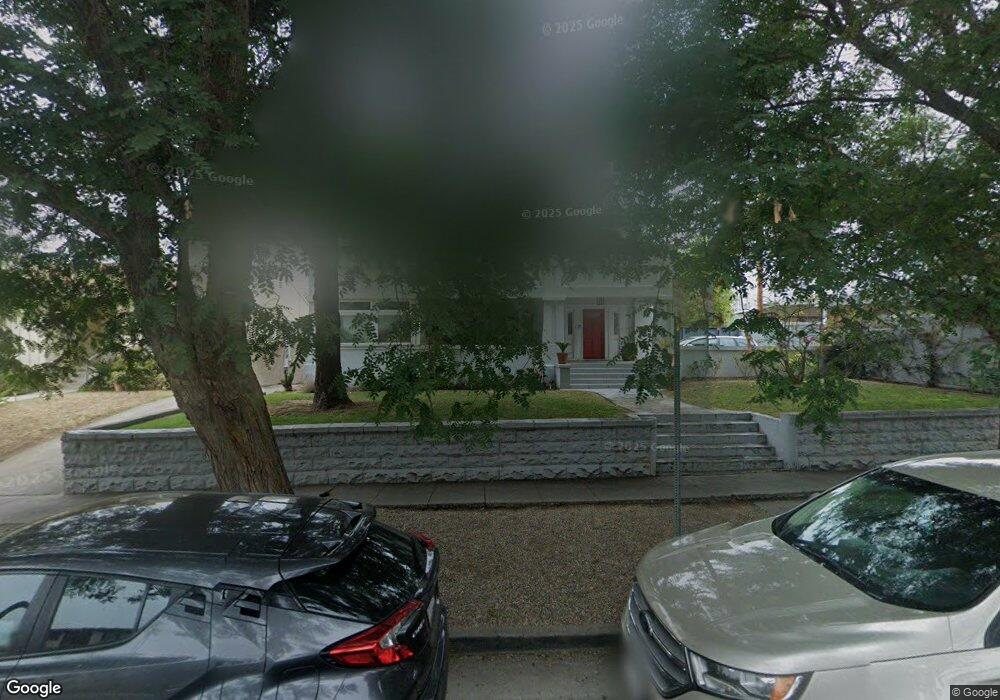
1417 S Spaulding Ave Los Angeles, CA 90019
Mid-City NeighborhoodEstimated Value: $1,862,000 - $2,299,402
5
Beds
2
Baths
3,036
Sq Ft
$673/Sq Ft
Est. Value
About This Home
This home is located at 1417 S Spaulding Ave, Los Angeles, CA 90019 and is currently estimated at $2,044,351, approximately $673 per square foot. 1417 S Spaulding Ave is a home located in Los Angeles County with nearby schools including Crescent Heights Boulevard Elementary School, Daniel Webster Middle School, and Fairfax High School.
Ownership History
Date
Name
Owned For
Owner Type
Purchase Details
Closed on
Apr 5, 2017
Sold by
Brockett Barbara
Bought by
Kim Christine Y and Gruenberg Kevin
Current Estimated Value
Home Financials for this Owner
Home Financials are based on the most recent Mortgage that was taken out on this home.
Original Mortgage
$682,500
Outstanding Balance
$551,538
Interest Rate
3.2%
Mortgage Type
Adjustable Rate Mortgage/ARM
Estimated Equity
$1,492,813
Purchase Details
Closed on
Nov 4, 1993
Sold by
California Federal Bank
Bought by
Brockett Barbara
Home Financials for this Owner
Home Financials are based on the most recent Mortgage that was taken out on this home.
Original Mortgage
$208,000
Interest Rate
6.88%
Mortgage Type
Seller Take Back
Purchase Details
Closed on
Aug 30, 1993
Sold by
Cal Fed Service Corp
Bought by
California Federal Bank
Create a Home Valuation Report for This Property
The Home Valuation Report is an in-depth analysis detailing your home's value as well as a comparison with similar homes in the area
Home Values in the Area
Average Home Value in this Area
Purchase History
| Date | Buyer | Sale Price | Title Company |
|---|---|---|---|
| Kim Christine Y | $1,050,000 | Fidelity National Title Co | |
| Brockett Barbara | $260,000 | Chicago Title Company | |
| California Federal Bank | $425,014 | Investors Title Company |
Source: Public Records
Mortgage History
| Date | Status | Borrower | Loan Amount |
|---|---|---|---|
| Open | Kim Christine Y | $682,500 | |
| Previous Owner | Brockett Barbara | $208,000 |
Source: Public Records
Tax History Compared to Growth
Tax History
| Year | Tax Paid | Tax Assessment Tax Assessment Total Assessment is a certain percentage of the fair market value that is determined by local assessors to be the total taxable value of land and additions on the property. | Land | Improvement |
|---|---|---|---|---|
| 2025 | $15,465 | $1,282,213 | $974,889 | $307,324 |
| 2024 | $15,465 | $1,257,073 | $955,774 | $301,299 |
| 2023 | $15,169 | $1,232,426 | $937,034 | $295,392 |
| 2022 | $14,470 | $1,208,261 | $918,661 | $289,600 |
| 2021 | $14,282 | $1,184,571 | $900,649 | $283,922 |
| 2019 | $13,855 | $1,092,420 | $873,936 | $218,484 |
| 2018 | $13,151 | $1,071,000 | $856,800 | $214,200 |
| 2016 | $4,662 | $373,290 | $229,719 | $143,571 |
| 2015 | $4,596 | $367,684 | $226,269 | $141,415 |
| 2014 | $4,618 | $360,482 | $221,837 | $138,645 |
Source: Public Records
Map
Nearby Homes
- 1329 S Genesee Ave
- 1363 S Curson Ave
- 1333 S Orange Grove Ave Unit 201
- 1333 S Orange Grove Ave Unit 311
- 1562 S Genesee Ave
- 1556 S Ogden Dr
- 1243 S Stanley Ave
- 1524 S Fairfax Ave
- 1501 S Fairfax Ave
- 1434 S Sierra Bonita Ave
- 1569 S Orange Grove Ave
- 1562 S Fairfax Ave
- 1610 Ellsmere Ave
- 1451 S Hayworth Ave
- 1570 S Hayworth Ave
- 1574 S Hayworth Ave
- 1236 Hi Point St
- 1118 S Fairfax Ave
- 1074 S Genesee Ave
- 1500 Hauser Blvd
- 1423 S Spaulding Ave
- 1429 S Spaulding Ave
- 5710 W Pico Blvd
- 1416 S Genesee Ave
- 1422 S Genesee Ave
- 1426 S Genesee Ave
- 1435 S Spaulding Ave
- 1428 S Genesee Ave
- 1416 S Spaulding Ave
- 1406 S Spaulding Ave
- 1434 S Genesee Ave
- 1434 1/2 S Genesee Ave
- 1434 1 2 S Genesee Ave
- 1414 S Spaulding Ave
- 1432 S Genesee Ave
- 1441 S Spaulding Ave
- 1420 S Spaulding Ave Unit 1420
- 1420 S Spaulding Ave
- 5658 W Pico Blvd
- 1430 S Spaulding Ave