1418 Blake St Berkeley, CA 94702
West Berkeley NeighborhoodEstimated Value: $945,000 - $1,351,000
2
Beds
1
Bath
1,566
Sq Ft
$782/Sq Ft
Est. Value
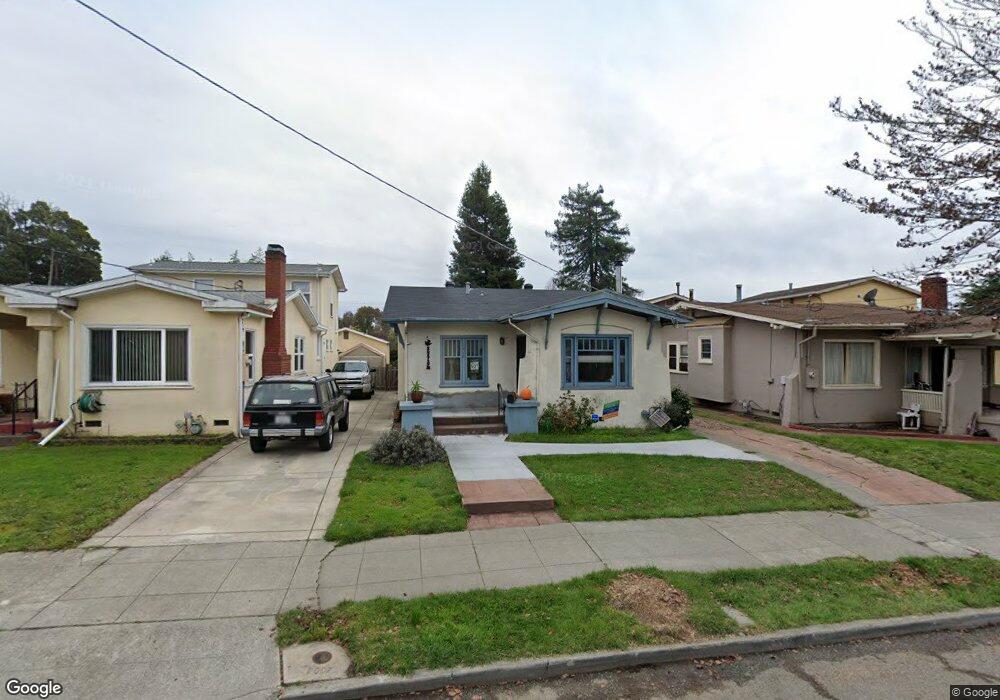
About This Home
This home is located at 1418 Blake St, Berkeley, CA 94702 and is currently estimated at $1,224,701, approximately $782 per square foot. 1418 Blake St is a home located in Alameda County with nearby schools including Washington Elementary School, Oxford Elementary School, and Malcolm X Elementary School.
Ownership History
Date
Name
Owned For
Owner Type
Purchase Details
Closed on
Feb 18, 2011
Sold by
Watson Mary Lou and Frankel Samuel R
Bought by
Frankel Samuel R and Watson Mary Lou
Current Estimated Value
Home Financials for this Owner
Home Financials are based on the most recent Mortgage that was taken out on this home.
Original Mortgage
$241,000
Interest Rate
4.67%
Mortgage Type
New Conventional
Create a Home Valuation Report for This Property
The Home Valuation Report is an in-depth analysis detailing your home's value as well as a comparison with similar homes in the area
Home Values in the Area
Average Home Value in this Area
Purchase History
| Date | Buyer | Sale Price | Title Company |
|---|---|---|---|
| Frankel Samuel R | -- | North American Title Co Inc |
Source: Public Records
Mortgage History
| Date | Status | Borrower | Loan Amount |
|---|---|---|---|
| Closed | Frankel Samuel R | $241,000 |
Source: Public Records
Tax History
| Year | Tax Paid | Tax Assessment Tax Assessment Total Assessment is a certain percentage of the fair market value that is determined by local assessors to be the total taxable value of land and additions on the property. | Land | Improvement |
|---|---|---|---|---|
| 2025 | $7,741 | $367,877 | $102,104 | $272,773 |
| 2024 | $7,741 | $360,527 | $100,102 | $267,425 |
| 2023 | $7,605 | $360,323 | $98,140 | $262,183 |
| 2022 | $7,141 | $346,257 | $96,215 | $257,042 |
| 2021 | $7,129 | $339,332 | $94,329 | $252,003 |
| 2020 | $6,675 | $342,782 | $93,362 | $249,420 |
| 2019 | $6,328 | $336,062 | $91,532 | $244,530 |
| 2018 | $6,191 | $329,473 | $89,737 | $239,736 |
| 2017 | $5,951 | $323,014 | $87,978 | $235,036 |
| 2016 | $5,695 | $316,681 | $86,253 | $230,428 |
| 2015 | $5,604 | $311,925 | $84,958 | $226,967 |
| 2014 | $5,486 | $305,816 | $83,294 | $222,522 |
Source: Public Records
Map
Nearby Homes
- 1515 Derby St
- 2750 Sacramento St
- 1450 Ward St
- 1612 Parker St
- 2758 Sacramento St
- 1612 Carleton St
- 2774 Sacramento St
- 2782 Sacramento St
- 2790 Sacramento St
- 1142 Dwight Way
- 1530 Stuart St
- 1645 Dwight Way
- 1118 Dwight Way
- 2727 McGee Ave
- 2324 Browning St
- 2751 Wallace St
- 2747 San Pablo Ave Unit 507
- 1092 Dwight Way
- 2922 Stanton St
- 1535 Julia St
Your Personal Tour Guide
Ask me questions while you tour the home.