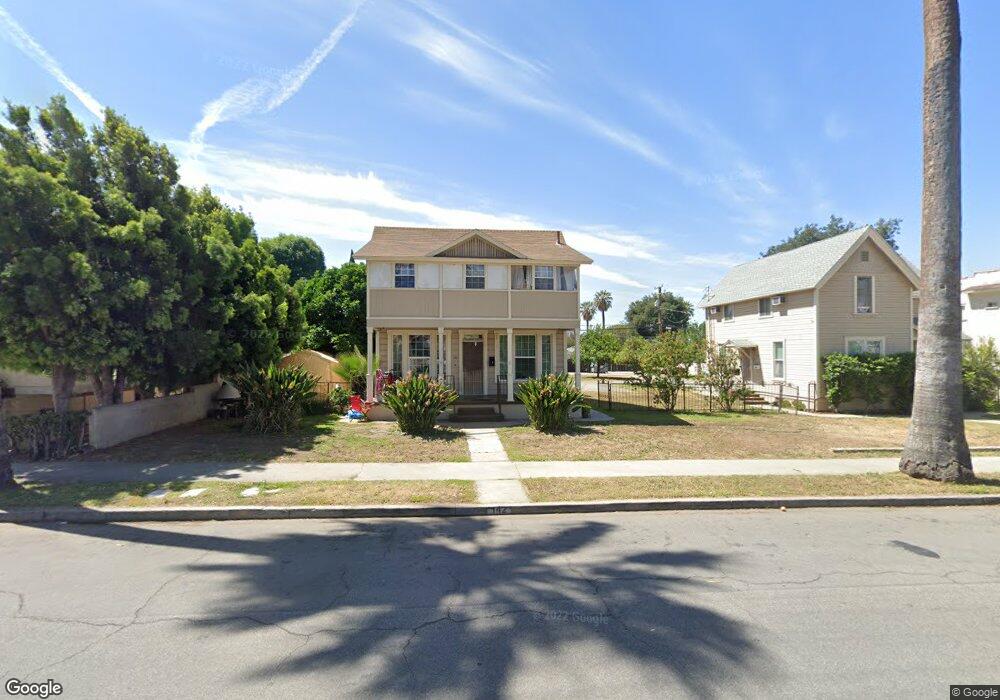
142 E Center St Unit A Covina, CA 91723
Estimated Value: $775,000 - $1,306,000
6
Beds
3
Baths
3,458
Sq Ft
$319/Sq Ft
Est. Value
About This Home
This home is located at 142 E Center St Unit A, Covina, CA 91723 and is currently estimated at $1,103,863, approximately $319 per square foot. 142 E Center St Unit A is a home located in Los Angeles County with nearby schools including Barranca Elementary School, South Hills High School, and Discovery Montessori Preschool Kindergarten.
Ownership History
Date
Name
Owned For
Owner Type
Purchase Details
Closed on
Dec 23, 2019
Sold by
Liang Xiuhua and Yu Li Qiong
Bought by
Liang Xiuhua and Yu Li Qiong
Current Estimated Value
Home Financials for this Owner
Home Financials are based on the most recent Mortgage that was taken out on this home.
Original Mortgage
$606,000
Outstanding Balance
$530,809
Interest Rate
3.6%
Mortgage Type
New Conventional
Estimated Equity
$573,054
Purchase Details
Closed on
Oct 21, 2014
Sold by
Droscher Barbara Wechsler
Bought by
Liang Xiu Hua and Yu Li Qiong
Home Financials for this Owner
Home Financials are based on the most recent Mortgage that was taken out on this home.
Original Mortgage
$497,500
Interest Rate
3.89%
Mortgage Type
Purchase Money Mortgage
Purchase Details
Closed on
Jul 24, 2006
Sold by
Droscher Barbara Wechsler and Wechsler Cathryn J
Bought by
Droscher Barbara Wechsler and Exempt Trust #1
Create a Home Valuation Report for This Property
The Home Valuation Report is an in-depth analysis detailing your home's value as well as a comparison with similar homes in the area
Home Values in the Area
Average Home Value in this Area
Purchase History
| Date | Buyer | Sale Price | Title Company |
|---|---|---|---|
| Liang Xiuhua | -- | Ticor Title Company Of Ca | |
| Liang Xiu Hua | $557,000 | Chicago Title Company | |
| Droscher Barbara Wechsler | -- | Accommodation |
Source: Public Records
Mortgage History
| Date | Status | Borrower | Loan Amount |
|---|---|---|---|
| Open | Liang Xiuhua | $606,000 | |
| Previous Owner | Liang Xiu Hua | $497,500 |
Source: Public Records
Tax History
| Year | Tax Paid | Tax Assessment Tax Assessment Total Assessment is a certain percentage of the fair market value that is determined by local assessors to be the total taxable value of land and additions on the property. | Land | Improvement |
|---|---|---|---|---|
| 2025 | $8,539 | $669,422 | $360,551 | $308,871 |
| 2024 | $8,539 | $656,297 | $353,482 | $302,815 |
| 2023 | $8,418 | $643,429 | $346,551 | $296,878 |
| 2022 | $8,309 | $630,813 | $339,756 | $291,057 |
| 2021 | $8,179 | $618,445 | $333,095 | $285,350 |
| 2020 | $8,070 | $612,105 | $329,680 | $282,425 |
| 2019 | $7,996 | $600,104 | $323,216 | $276,888 |
| 2018 | $7,654 | $588,338 | $316,879 | $271,459 |
| 2016 | $7,230 | $565,494 | $304,575 | $260,919 |
| 2015 | $7,024 | $557,000 | $300,000 | $257,000 |
| 2014 | $3,031 | $203,926 | $96,868 | $107,058 |
Source: Public Records
Map
Nearby Homes
- 428 Lemonade Place
- 735 Marmalade Place
- 733 Marmalade Place
- 745 Marmalade Place
- 342 Hollenbeck
- 231 231-1/2 E Dexter St
- 231 E Dexter St
- 137 S 3rd Ave
- 530 S Stewart Dr
- 217 W Zinfandel Dr
- 447 S Newton St
- 567 S Aldenville Ave
- 544 E Rue Royale St
- 566 S Hepner Ave
- 123 S Hollenbeck Ave
- 658 Calamansi Dr
- 511 W Puente St Unit 1
- 709 Cara Ln
- 704 Cara Ln
- 523 N Larkin Dr
- 142 E Center St
- 134 E Center St
- 160 E Center St Unit E
- 160 E Center St
- 160 E Center St Unit C
- 124 E Center St
- 126 E Center St Unit A
- 120 E Center St
- 166 E Center St
- 139 E Dexter St
- 149 E Dexter St
- 116 E Center St
- 116 E Center St
- 131 E Dexter St
- 157 E Dexter St
- 172 E Center St
- 123 E Dexter St
- 165 E Dexter St
- 115 E Dexter St
- 324 Pummenlo Plaza
Your Personal Tour Guide
Ask me questions while you tour the home.