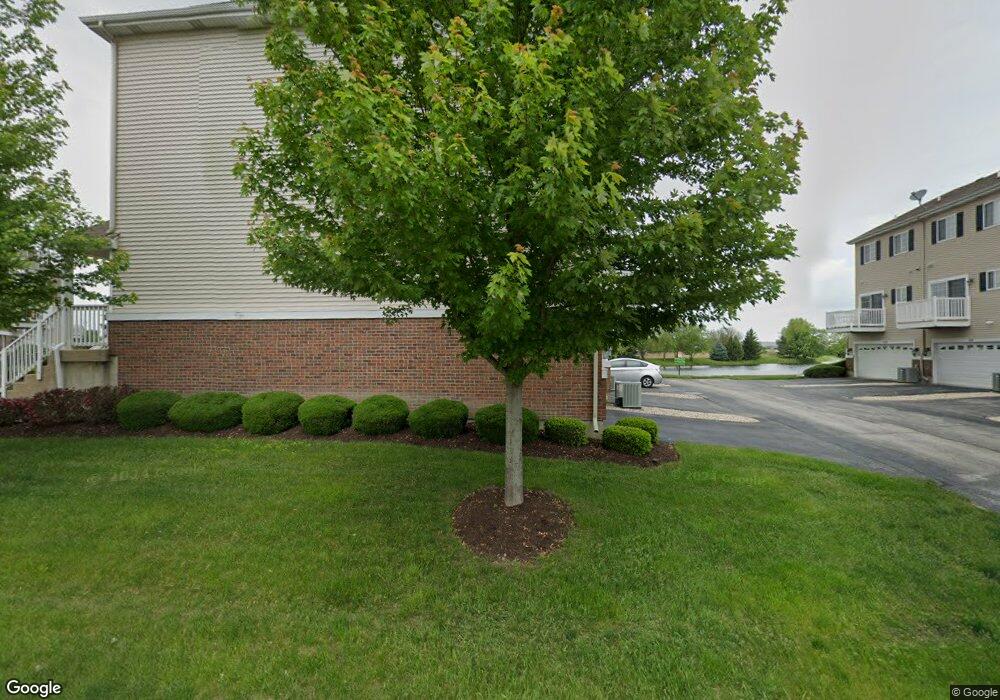
142 Lakeshore Dr Unit 16 Oswego, IL 60543
South Oswego NeighborhoodEstimated Value: $316,000 - $333,000
2
Beds
4
Baths
1,518
Sq Ft
$215/Sq Ft
Est. Value
About This Home
This home is located at 142 Lakeshore Dr Unit 16, Oswego, IL 60543 and is currently estimated at $326,043, approximately $214 per square foot. 142 Lakeshore Dr Unit 16 is a home located in Kendall County with nearby schools including Southbury Elementary School, Traughber Junior High School, and Oswego High School.
Ownership History
Date
Name
Owned For
Owner Type
Purchase Details
Closed on
Dec 9, 2021
Sold by
Erica Constant
Bought by
Witzel Gary E and Witzel Susan M
Current Estimated Value
Home Financials for this Owner
Home Financials are based on the most recent Mortgage that was taken out on this home.
Original Mortgage
$183,375
Interest Rate
3.56%
Mortgage Type
New Conventional
Purchase Details
Closed on
Sep 7, 2016
Sold by
Esparza Jose M
Bought by
Constant Erica
Home Financials for this Owner
Home Financials are based on the most recent Mortgage that was taken out on this home.
Original Mortgage
$163,975
Interest Rate
3.25%
Mortgage Type
FHA
Purchase Details
Closed on
Jul 3, 2013
Sold by
Station Ii Llc
Bought by
Esparza Jose M
Home Financials for this Owner
Home Financials are based on the most recent Mortgage that was taken out on this home.
Original Mortgage
$112,917
Interest Rate
3.87%
Mortgage Type
FHA
Create a Home Valuation Report for This Property
The Home Valuation Report is an in-depth analysis detailing your home's value as well as a comparison with similar homes in the area
Home Values in the Area
Average Home Value in this Area
Purchase History
| Date | Buyer | Sale Price | Title Company |
|---|---|---|---|
| Witzel Gary E | $244,500 | Chicago Title | |
| Constant Erica | $167,000 | Stewart Title | |
| Esparza Jose M | $115,000 | Chicago Title Insurance Co |
Source: Public Records
Mortgage History
| Date | Status | Borrower | Loan Amount |
|---|---|---|---|
| Previous Owner | Witzel Gary E | $183,375 | |
| Previous Owner | Constant Erica | $163,975 | |
| Previous Owner | Esparza Jose M | $112,917 |
Source: Public Records
Tax History Compared to Growth
Tax History
| Year | Tax Paid | Tax Assessment Tax Assessment Total Assessment is a certain percentage of the fair market value that is determined by local assessors to be the total taxable value of land and additions on the property. | Land | Improvement |
|---|---|---|---|---|
| 2024 | $6,829 | $90,864 | $25,751 | $65,113 |
| 2023 | $6,179 | $81,129 | $22,992 | $58,137 |
| 2022 | $6,179 | $74,431 | $21,094 | $53,337 |
| 2021 | $5,828 | $68,285 | $19,352 | $48,933 |
| 2020 | $5,578 | $65,033 | $18,430 | $46,603 |
| 2019 | $5,454 | $62,814 | $18,430 | $44,384 |
| 2018 | $4,535 | $52,892 | $15,519 | $37,373 |
| 2017 | $4,382 | $48,748 | $14,303 | $34,445 |
| 2016 | $3,985 | $44,317 | $13,003 | $31,314 |
| 2015 | $3,740 | $40,288 | $11,821 | $28,467 |
| 2014 | -- | $39,115 | $11,477 | $27,638 |
| 2013 | -- | $0 | $0 | $0 |
Source: Public Records
Map
Nearby Homes
- 706 Springside Ct
- 809 Canton Dr
- 1444 Vintage Dr
- 521 Litchfield Way
- 621 Mansfield Way
- 94 Templeton Dr
- 633 Mansfield Way
- 555 Litchfield Way
- 101 Bell Ct
- 80 Stonehill Rd
- 177 Franklin St
- 747 Fairfield Dr
- 749 Fairfield Dr
- 1451 Vintage Dr
- 856 Preston Ln
- Lyndale Plan at Southbury
- 215 Willington Way
- Hudson Plan at Southbury
- Essex Plan at Southbury
- 858 Preston Ln
- 142 Lakeshore Dr
- 140 Lakeshore Dr Unit 17
- 140 Lakeshore Dr
- 144 Lakeshore Dr
- 138 Lakeshore Dr Unit 18
- 138 Lakeshore Dr
- 124 Lakeshore Dr Unit 124
- 126 Lakeshore Dr
- 130 Lakeshore Dr
- 128 Lakeshore Dr
- 128 Lakeshore Dr Unit 22
- 128 Lakeshore Dr Unit 13
- 151 Lakeshore Dr Unit 151
- 153 Lakeshore Dr
- 155 Lakeshore Dr
- 184 Lakeshore Dr Unit C
- 157 Lakeshore Dr
- 157 Lakeshore Dr Unit 22
- 702 Springside Ct
- 159 Lakeshore Dr