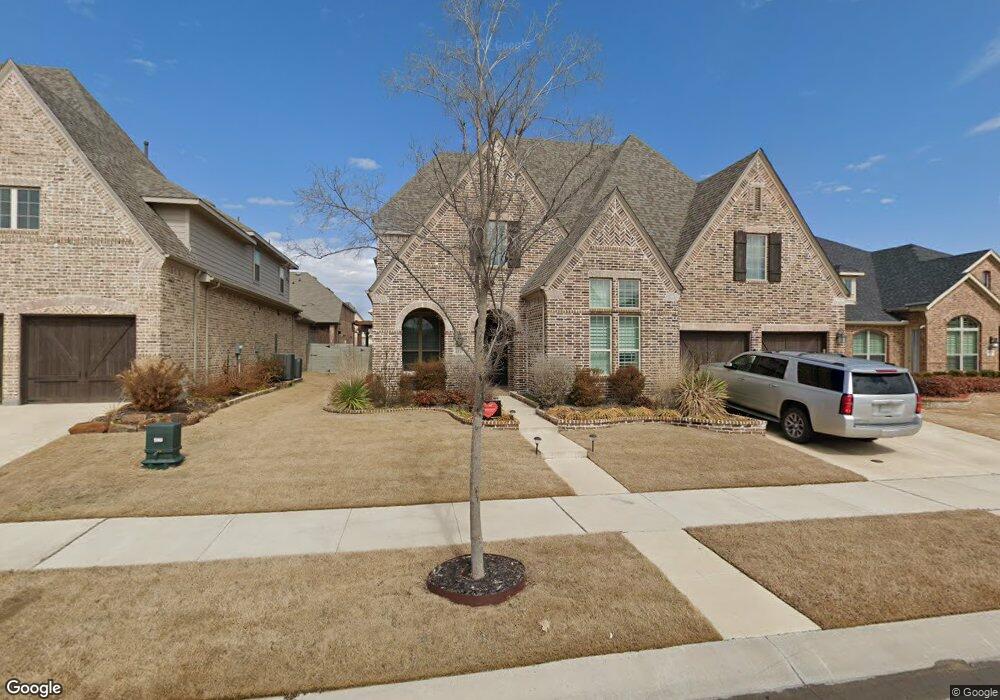
1420 10th St Argyle, TX 76226
Harvest NeighborhoodEstimated Value: $672,000 - $754,000
5
Beds
4
Baths
4,005
Sq Ft
$176/Sq Ft
Est. Value
About This Home
This home is located at 1420 10th St, Argyle, TX 76226 and is currently estimated at $706,345, approximately $176 per square foot. 1420 10th St is a home located in Denton County with nearby schools including Argyle West, Argyle Middle School, and Argyle High School.
Ownership History
Date
Name
Owned For
Owner Type
Purchase Details
Closed on
Nov 22, 2017
Sold by
Francis Matthew and Francis Angela
Bought by
Shuler William Perry
Current Estimated Value
Home Financials for this Owner
Home Financials are based on the most recent Mortgage that was taken out on this home.
Original Mortgage
$388,000
Outstanding Balance
$325,640
Interest Rate
3.91%
Mortgage Type
New Conventional
Estimated Equity
$380,705
Purchase Details
Closed on
Jul 22, 2016
Sold by
Highland Homes Dallas Llc
Bought by
Francis Matthew and Francis Angela
Home Financials for this Owner
Home Financials are based on the most recent Mortgage that was taken out on this home.
Original Mortgage
$417,000
Interest Rate
3.6%
Mortgage Type
New Conventional
Purchase Details
Closed on
Jan 22, 2016
Sold by
Harvest Phase Ii Llc
Bought by
Highland Homes Dallas Llc
Create a Home Valuation Report for This Property
The Home Valuation Report is an in-depth analysis detailing your home's value as well as a comparison with similar homes in the area
Home Values in the Area
Average Home Value in this Area
Purchase History
| Date | Buyer | Sale Price | Title Company |
|---|---|---|---|
| Shuler William Perry | -- | None Available | |
| Francis Matthew | -- | Attorney | |
| Highland Homes Dallas Llc | -- | Ortc |
Source: Public Records
Mortgage History
| Date | Status | Borrower | Loan Amount |
|---|---|---|---|
| Open | Shuler William Perry | $388,000 | |
| Previous Owner | Francis Matthew | $417,000 |
Source: Public Records
Tax History
| Year | Tax Paid | Tax Assessment Tax Assessment Total Assessment is a certain percentage of the fair market value that is determined by local assessors to be the total taxable value of land and additions on the property. | Land | Improvement |
|---|---|---|---|---|
| 2025 | $14,315 | $674,000 | $167,786 | $506,214 |
| 2024 | $14,917 | $698,775 | $0 | $0 |
| 2023 | $12,825 | $635,250 | $102,171 | $657,829 |
| 2022 | $15,988 | $577,500 | $108,413 | $542,587 |
| 2021 | $15,087 | $525,000 | $92,925 | $432,075 |
| 2020 | $14,276 | $476,951 | $92,925 | $384,026 |
| 2019 | $14,816 | $477,839 | $92,925 | $384,914 |
| 2018 | $14,472 | $495,124 | $92,925 | $402,199 |
| 2017 | $13,220 | $453,000 | $92,925 | $360,075 |
| 2016 | $1,337 | $69,694 | $69,694 | $0 |
Source: Public Records
Map
Nearby Homes
Your Personal Tour Guide
Ask me questions while you tour the home.