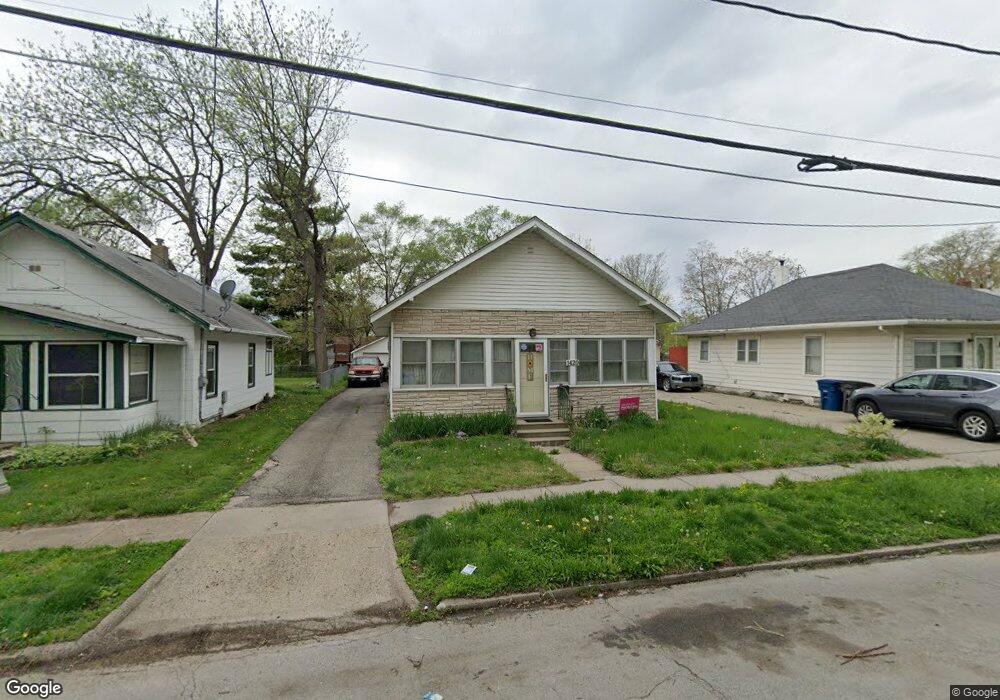
1420 E 23rd St Des Moines, IA 50317
Accent NeighborhoodEstimated Value: $152,000 - $178,000
3
Beds
1
Bath
946
Sq Ft
$177/Sq Ft
Est. Value
About This Home
This home is located at 1420 E 23rd St, Des Moines, IA 50317 and is currently estimated at $167,723, approximately $177 per square foot. 1420 E 23rd St is a home located in Polk County with nearby schools including Phillips Elementary, Joshua Christian Academy-Main Campus, and St Joseph Elementary School.
Ownership History
Date
Name
Owned For
Owner Type
Purchase Details
Closed on
Jan 2, 2003
Sold by
Rumelhart Jeffrey O and Rumelhart June L
Bought by
Creason Douglas W and Creason Tracy L
Current Estimated Value
Home Financials for this Owner
Home Financials are based on the most recent Mortgage that was taken out on this home.
Original Mortgage
$78,000
Outstanding Balance
$33,239
Interest Rate
6.13%
Estimated Equity
$134,484
Create a Home Valuation Report for This Property
The Home Valuation Report is an in-depth analysis detailing your home's value as well as a comparison with similar homes in the area
Home Values in the Area
Average Home Value in this Area
Purchase History
| Date | Buyer | Sale Price | Title Company |
|---|---|---|---|
| Creason Douglas W | $77,500 | -- |
Source: Public Records
Mortgage History
| Date | Status | Borrower | Loan Amount |
|---|---|---|---|
| Open | Creason Douglas W | $78,000 |
Source: Public Records
Tax History Compared to Growth
Tax History
| Year | Tax Paid | Tax Assessment Tax Assessment Total Assessment is a certain percentage of the fair market value that is determined by local assessors to be the total taxable value of land and additions on the property. | Land | Improvement |
|---|---|---|---|---|
| 2025 | $2,294 | $144,200 | $22,900 | $121,300 |
| 2024 | $2,294 | $127,100 | $20,100 | $107,000 |
| 2023 | $2,164 | $127,100 | $20,100 | $107,000 |
| 2022 | $2,146 | $100,700 | $16,800 | $83,900 |
| 2021 | $2,058 | $100,700 | $16,800 | $83,900 |
| 2020 | $2,134 | $91,100 | $15,300 | $75,800 |
| 2019 | $1,940 | $91,100 | $15,300 | $75,800 |
| 2018 | $1,914 | $80,700 | $13,500 | $67,200 |
| 2017 | $1,854 | $80,700 | $13,500 | $67,200 |
| 2016 | $1,802 | $77,100 | $12,700 | $64,400 |
| 2015 | $1,802 | $77,100 | $12,700 | $64,400 |
| 2014 | $1,620 | $69,700 | $11,500 | $58,200 |
Source: Public Records
Map
Nearby Homes