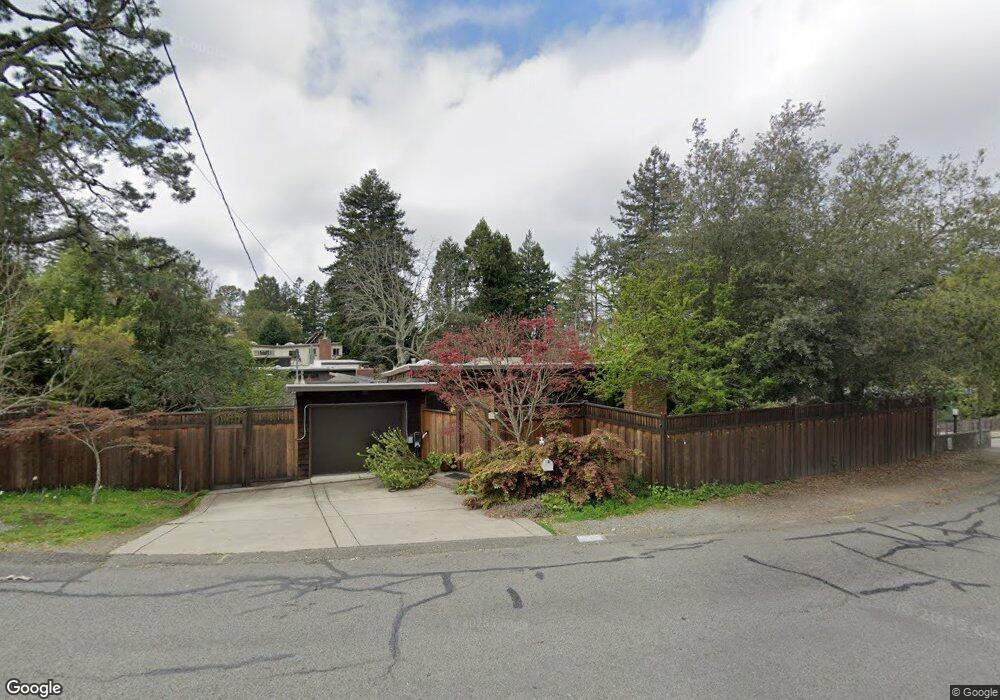
1420 Grizzly Peak Blvd Berkeley, CA 94708
Berkeley Hills NeighborhoodEstimated Value: $1,252,000 - $1,527,000
3
Beds
3
Baths
1,700
Sq Ft
$816/Sq Ft
Est. Value
About This Home
This home is located at 1420 Grizzly Peak Blvd, Berkeley, CA 94708 and is currently estimated at $1,386,821, approximately $815 per square foot. 1420 Grizzly Peak Blvd is a home located in Alameda County with nearby schools including Cragmont Elementary School, Berkeley Arts Magnet at Whittier School, and Washington Elementary School.
Ownership History
Date
Name
Owned For
Owner Type
Purchase Details
Closed on
Oct 13, 2015
Sold by
Doksum Kjell A and Fujimura Joan H
Bought by
Montes Eduardo and Baradar Forooza
Current Estimated Value
Home Financials for this Owner
Home Financials are based on the most recent Mortgage that was taken out on this home.
Original Mortgage
$689,600
Outstanding Balance
$542,017
Interest Rate
3.85%
Mortgage Type
New Conventional
Estimated Equity
$844,804
Purchase Details
Closed on
Nov 17, 1993
Sold by
Doksum Kjell A and Fujimura Joan H
Bought by
Doksum Kjell A and Fujimura Joan H
Home Financials for this Owner
Home Financials are based on the most recent Mortgage that was taken out on this home.
Original Mortgage
$178,000
Interest Rate
6.85%
Create a Home Valuation Report for This Property
The Home Valuation Report is an in-depth analysis detailing your home's value as well as a comparison with similar homes in the area
Home Values in the Area
Average Home Value in this Area
Purchase History
| Date | Buyer | Sale Price | Title Company |
|---|---|---|---|
| Montes Eduardo | $862,000 | Chicago Title Company | |
| Doksum Kjell A | -- | First American Title Guarant |
Source: Public Records
Mortgage History
| Date | Status | Borrower | Loan Amount |
|---|---|---|---|
| Open | Montes Eduardo | $689,600 | |
| Previous Owner | Doksum Kjell A | $178,000 |
Source: Public Records
Tax History
| Year | Tax Paid | Tax Assessment Tax Assessment Total Assessment is a certain percentage of the fair market value that is determined by local assessors to be the total taxable value of land and additions on the property. | Land | Improvement |
|---|---|---|---|---|
| 2025 | $15,739 | $1,013,409 | $355,131 | $665,278 |
| 2024 | $15,739 | $993,402 | $348,168 | $652,234 |
| 2023 | $15,357 | $980,792 | $341,343 | $639,449 |
| 2022 | $15,031 | $954,561 | $334,650 | $626,911 |
| 2021 | $15,071 | $935,709 | $328,089 | $614,620 |
| 2020 | $14,327 | $933,046 | $324,726 | $608,320 |
| 2019 | $13,823 | $914,754 | $318,360 | $596,394 |
| 2018 | $13,585 | $896,824 | $312,120 | $584,704 |
| 2017 | $13,115 | $879,240 | $306,000 | $573,240 |
| 2016 | $12,564 | $862,000 | $300,000 | $562,000 |
| 2015 | $5,862 | $308,825 | $113,712 | $195,113 |
| 2014 | $5,741 | $302,775 | $111,484 | $191,291 |
Source: Public Records
Map
Nearby Homes
- 1468 Summit Rd
- 1375 Queens Rd
- 0 Queens Rd Unit ML82024219
- 120 Hill Rd
- 1123 Park Hills Rd
- 1110 Sterling Ave
- 1165 Cragmont Ave
- 1119 Miller Ave
- 2700 Le Conte Ave Unit 301
- 2700 Le Conte Ave Unit 402
- 2600 Hilgard Ave
- 2634 Virginia St Unit 13
- 2501 Rose Walk
- 1136 Keith Ave
- 1106 Cragmont Ave
- 1471 Scenic Ave
- 2451 Le Conte Ave
- 1024 Miller Ave
- 2340 Virginia St
- 982 Grizzly Peak Blvd
- 1430 Grizzly Peak Blvd
- 1416 Grizzly Peak Blvd
- 1434 Grizzly Peak Blvd
- 1417 Grizzly Peak Blvd
- 1415 Grizzly Peak Blvd
- 1419 Grizzly Peak Blvd
- 1425 Grizzly Peak Blvd
- 1427 Grizzly Peak Blvd
- 1429 Grizzly Peak Blvd
- 1408 Grizzly Peak Blvd
- 1411 Grizzly Peak Blvd
- 1444 Grizzly Peak Blvd
- 1435 Grizzly Peak Blvd
- 1407 Grizzly Peak Blvd
- 1441 Grizzly Peak Blvd
- 1446 Grizzly Peak Blvd
- 148 Avenida Dr
- 1400 Grizzly Peak Blvd
- 1445 Grizzly Peak Blvd
- 1384 Summit Rd
Your Personal Tour Guide
Ask me questions while you tour the home.