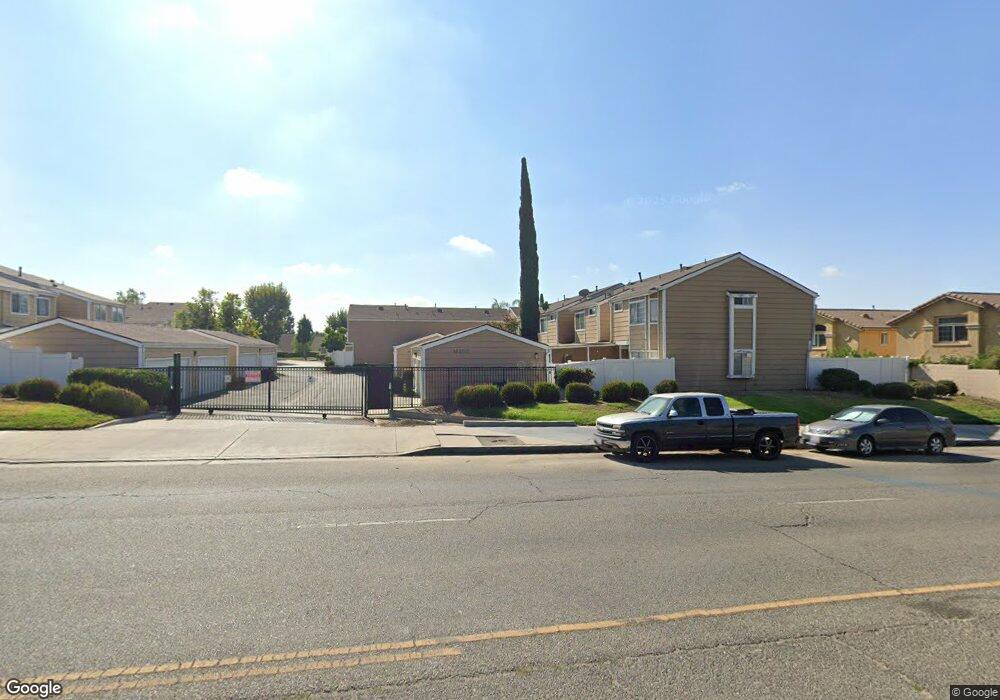
14200 Polk St Unit 6 Sylmar, CA 91342
Estimated Value: $532,000 - $558,000
3
Beds
2
Baths
1,208
Sq Ft
$447/Sq Ft
Est. Value
About This Home
This home is located at 14200 Polk St Unit 6, Sylmar, CA 91342 and is currently estimated at $539,736, approximately $446 per square foot. 14200 Polk St Unit 6 is a home located in Los Angeles County with nearby schools including Sylmar Elementary School, Olive Vista Middle School, and San Fernando Senior High School.
Ownership History
Date
Name
Owned For
Owner Type
Purchase Details
Closed on
Apr 10, 2025
Sold by
Mcdevitt Family 2005 Trust and Mcdevitt Mark W
Bought by
Lighthouse Properties 421 Llc
Current Estimated Value
Purchase Details
Closed on
Mar 23, 2009
Sold by
Wells Fargo Bank Na
Bought by
Mcdevitt Mark W
Purchase Details
Closed on
Nov 10, 2008
Sold by
Gonzalez Maria Rosa
Bought by
Wells Fargo Bank Na
Purchase Details
Closed on
Aug 4, 2006
Sold by
Raphael Anita Y
Bought by
Gonzalez Maria Rosa
Home Financials for this Owner
Home Financials are based on the most recent Mortgage that was taken out on this home.
Original Mortgage
$314,000
Interest Rate
6.99%
Mortgage Type
Stand Alone First
Create a Home Valuation Report for This Property
The Home Valuation Report is an in-depth analysis detailing your home's value as well as a comparison with similar homes in the area
Home Values in the Area
Average Home Value in this Area
Purchase History
| Date | Buyer | Sale Price | Title Company |
|---|---|---|---|
| Lighthouse Properties 421 Llc | -- | None Listed On Document | |
| Lighthouse Properties 421 Llc | -- | None Listed On Document | |
| Mcdevitt Mark W | $150,000 | Lsi Title Fnds Division | |
| Wells Fargo Bank Na | $314,750 | Accommodation | |
| Gonzalez Maria Rosa | $392,500 | First Southwestern Title Co |
Source: Public Records
Mortgage History
| Date | Status | Borrower | Loan Amount |
|---|---|---|---|
| Previous Owner | Gonzalez Maria Rosa | $314,000 |
Source: Public Records
Tax History Compared to Growth
Tax History
| Year | Tax Paid | Tax Assessment Tax Assessment Total Assessment is a certain percentage of the fair market value that is determined by local assessors to be the total taxable value of land and additions on the property. | Land | Improvement |
|---|---|---|---|---|
| 2025 | $2,497 | $193,145 | $38,623 | $154,522 |
| 2024 | $2,497 | $189,359 | $37,866 | $151,493 |
| 2023 | $2,452 | $185,647 | $37,124 | $148,523 |
| 2022 | $2,341 | $182,008 | $36,397 | $145,611 |
| 2021 | $2,308 | $178,440 | $35,684 | $142,756 |
| 2019 | $2,241 | $173,150 | $34,627 | $138,523 |
| 2018 | $2,198 | $169,756 | $33,949 | $135,807 |
| 2016 | $2,090 | $163,167 | $32,632 | $130,535 |
| 2015 | $2,061 | $160,717 | $32,142 | $128,575 |
| 2014 | $2,075 | $157,570 | $31,513 | $126,057 |
Source: Public Records
Map
Nearby Homes
- 14020 Foothill Blvd
- 14039 Astoria St Unit 114
- 14031 Astoria St Unit 102
- 14401 Lakeside St
- 14523 Ryan St
- 14287 Foothill Blvd Unit 33
- 14291 Foothill Blvd Unit 11
- 14293 Foothill Blvd Unit 21
- 14293 Foothill Blvd Unit 19
- 13080 Dronfield Ave
- 13080 Dronfield Ave Unit 13
- 13659 Gladstone Ave
- 13144 Bromont Ave Unit 42
- 13108 Fellows Ave
- 14325 Foothill Blvd Unit 34
- 14344 Foothill Blvd Unit 306
- 13050 Dronfield Ave Unit 21
- 13050 Dronfield Ave Unit 7
- 13016 Jamie Ave
- 13040 Dronfield Ave Unit 12
- 14200 Polk St
- 14200 Polk St Unit 7
- 14200 Polk St Unit 46
- 14200 Polk St Unit 45
- 14200 Polk St Unit 43
- 14200 Polk St Unit 42
- 14200 Polk St Unit 41
- 14200 Polk St Unit 40
- 14200 Polk St Unit 39
- 14200 Polk St Unit 38
- 14200 Polk St Unit 37
- 14200 Polk St Unit 36
- 14200 Polk St Unit 35
- 14200 Polk St Unit 34
- 14200 Polk St Unit 33
- 14200 Polk St Unit 32
- 14200 Polk St Unit 31
- 14200 Polk St Unit 30
- 14200 Polk St Unit 29
- 14200 Polk St Unit 28