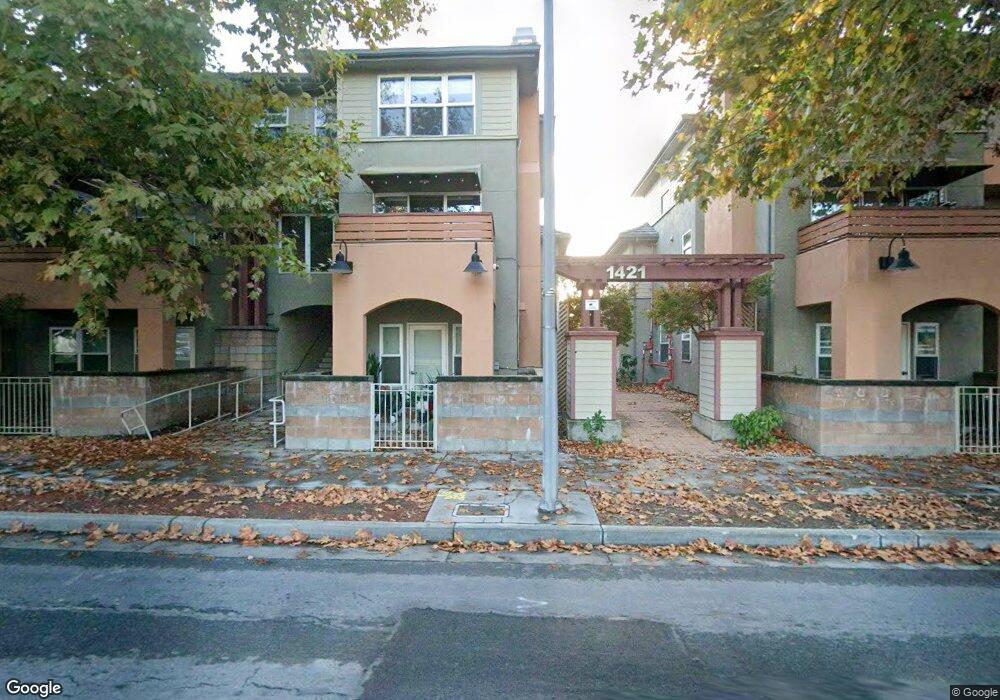
1421 N 1st St Unit 103 San Jose, CA 95112
Estimated Value: $446,000 - $553,000
1
Bed
1
Bath
674
Sq Ft
$720/Sq Ft
Est. Value
About This Home
This home is located at 1421 N 1st St Unit 103, San Jose, CA 95112 and is currently estimated at $485,558, approximately $720 per square foot. 1421 N 1st St Unit 103 is a home located in Santa Clara County with nearby schools including Muwekma Ohlone Middle, Abraham Lincoln High, and Walter L. Bachrodt Elementary School.
Ownership History
Date
Name
Owned For
Owner Type
Purchase Details
Closed on
Jan 24, 2019
Sold by
Shih Chieh Chang Jeffry and Fu-Jane Lee
Bought by
Fu-Jane Chieh Chang Jeffry Shih and Fu-Jane Lee
Current Estimated Value
Home Financials for this Owner
Home Financials are based on the most recent Mortgage that was taken out on this home.
Original Mortgage
$250,000
Outstanding Balance
$219,801
Interest Rate
4.6%
Mortgage Type
Commercial
Estimated Equity
$265,757
Purchase Details
Closed on
Mar 27, 2017
Sold by
Fan Family Llc
Bought by
Chang Jeffry Shih Chieh and Lee Fu Jane
Purchase Details
Closed on
May 3, 2016
Sold by
Bellagio Garden Llc
Bought by
Fan Family Llc
Home Financials for this Owner
Home Financials are based on the most recent Mortgage that was taken out on this home.
Original Mortgage
$1,737,653
Interest Rate
3.59%
Mortgage Type
Purchase Money Mortgage
Create a Home Valuation Report for This Property
The Home Valuation Report is an in-depth analysis detailing your home's value as well as a comparison with similar homes in the area
Home Values in the Area
Average Home Value in this Area
Purchase History
| Date | Buyer | Sale Price | Title Company |
|---|---|---|---|
| Fu-Jane Chieh Chang Jeffry Shih | -- | First American Title Co | |
| Chang Jeffry Shih Chieh | $300,000 | None Available | |
| Fan Family Llc | $1,738,000 | First American Title Company |
Source: Public Records
Mortgage History
| Date | Status | Borrower | Loan Amount |
|---|---|---|---|
| Open | Fu-Jane Chieh Chang Jeffry Shih | $250,000 | |
| Previous Owner | Fan Family Llc | $1,737,653 |
Source: Public Records
Tax History Compared to Growth
Tax History
| Year | Tax Paid | Tax Assessment Tax Assessment Total Assessment is a certain percentage of the fair market value that is determined by local assessors to be the total taxable value of land and additions on the property. | Land | Improvement |
|---|---|---|---|---|
| 2025 | $5,363 | $417,804 | $208,902 | $208,902 |
| 2024 | $5,363 | $409,612 | $204,806 | $204,806 |
| 2023 | $5,259 | $401,582 | $200,791 | $200,791 |
| 2022 | $5,233 | $393,708 | $196,854 | $196,854 |
| 2021 | $5,133 | $385,990 | $192,995 | $192,995 |
| 2020 | $5,050 | $382,034 | $191,017 | $191,017 |
| 2019 | $4,957 | $374,544 | $187,272 | $187,272 |
| 2018 | $4,913 | $367,200 | $183,600 | $183,600 |
| 2017 | $5,023 | $372,300 | $186,150 | $186,150 |
| 2016 | $2,077 | $132,853 | $36,324 | $96,529 |
| 2015 | $2,053 | $130,859 | $35,779 | $95,080 |
| 2014 | $1,983 | $128,297 | $35,079 | $93,218 |
Source: Public Records
Map
Nearby Homes
- 1421 N 1st St Unit 251
- 1550 Technology Dr Unit 2112
- 1550 Technology Dr Unit 1072
- 1550 Technology Dr Unit 2005
- 1107 N 4th St
- 115 Burton Ave
- 1085 N 4th St
- 861 N 5th St
- 494 Madera Ave
- 1025 N 12th St
- 800 N 8th St Unit 120
- 800 N 8th St Unit 311
- 800 N 8th St Unit 207
- 350 E Mission St Unit 211
- 350 E Mission St Unit 115
- 0 E Hedding St
- 622 Berryessa Rd
- 647 N 2nd St
- 748-3 N 10th St
- 35 George St
- 1421 N 1st St Unit 259
- 1421 N 1st St Unit 258
- 1421 N 1st St Unit 257
- 1421 N 1st St Unit 256
- 1421 N 1st St Unit 255
- 1421 N 1st St Unit 254
- 1421 N 1st St Unit 253
- 1421 N 1st St Unit 159
- 1421 N 1st St Unit 156
- 1421 N 1st St Unit 153
- 1421 N 1st St Unit 151
- 1421 N 1st St Unit 207
- 1421 N 1st St Unit 206
- 1421 N 1st St Unit 205
- 1421 N 1st St Unit 204
- 1421 N 1st St Unit 203
- 1421 N 1st St Unit 201
- 1421 N 1st St Unit 109
- 1421 N 1st St Unit 106
- 1421 N 1st St Unit 101