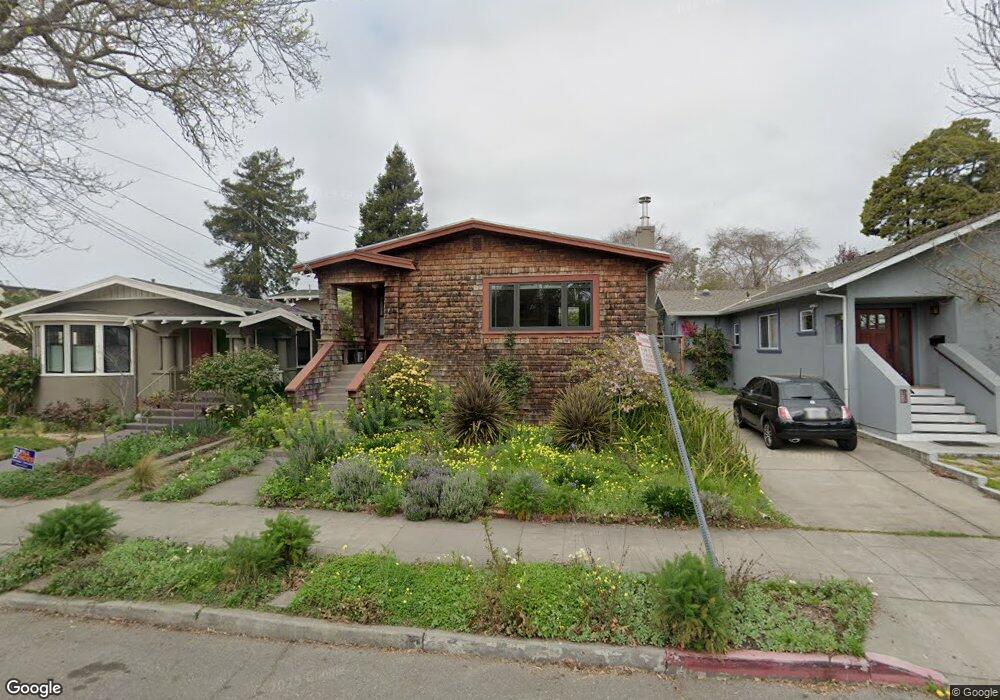
1421 Parker St Berkeley, CA 94702
West Berkeley NeighborhoodEstimated Value: $1,221,623 - $1,277,000
1
Bed
2
Baths
959
Sq Ft
$1,303/Sq Ft
Est. Value
About This Home
This home is located at 1421 Parker St, Berkeley, CA 94702 and is currently estimated at $1,249,656, approximately $1,303 per square foot. 1421 Parker St is a home located in Alameda County with nearby schools including Washington Elementary School, Malcolm X Elementary School, and Oxford Elementary School.
Ownership History
Date
Name
Owned For
Owner Type
Purchase Details
Closed on
Jul 30, 2019
Sold by
Saunders Stuart R
Bought by
Ball Rosemary Panzarello and Ball James
Current Estimated Value
Home Financials for this Owner
Home Financials are based on the most recent Mortgage that was taken out on this home.
Original Mortgage
$600,000
Outstanding Balance
$525,489
Interest Rate
3.7%
Mortgage Type
New Conventional
Estimated Equity
$724,167
Purchase Details
Closed on
Jan 16, 2017
Sold by
Sonnenberg Mary Beth and Saunders Stuart R
Bought by
Saunders Stuart R
Create a Home Valuation Report for This Property
The Home Valuation Report is an in-depth analysis detailing your home's value as well as a comparison with similar homes in the area
Home Values in the Area
Average Home Value in this Area
Purchase History
| Date | Buyer | Sale Price | Title Company |
|---|---|---|---|
| Ball Rosemary Panzarello | $1,000,000 | Chicago Title Company | |
| Saunders Stuart R | -- | None Available |
Source: Public Records
Mortgage History
| Date | Status | Borrower | Loan Amount |
|---|---|---|---|
| Open | Ball Rosemary Panzarello | $600,000 |
Source: Public Records
Tax History
| Year | Tax Paid | Tax Assessment Tax Assessment Total Assessment is a certain percentage of the fair market value that is determined by local assessors to be the total taxable value of land and additions on the property. | Land | Improvement |
|---|---|---|---|---|
| 2025 | $17,027 | $1,086,630 | $546,815 | $546,815 |
| 2024 | $17,027 | $1,065,190 | $536,095 | $536,095 |
| 2023 | $16,610 | $1,051,170 | $525,585 | $525,585 |
| 2022 | $16,247 | $1,023,560 | $515,280 | $515,280 |
| 2021 | $16,286 | $1,003,360 | $505,180 | $505,180 |
| 2020 | $15,517 | $1,000,000 | $500,000 | $500,000 |
| 2019 | $6,299 | $279,237 | $76,405 | $202,832 |
| 2018 | $6,145 | $273,762 | $74,907 | $198,855 |
| 2017 | $6,049 | $280,169 | $73,438 | $206,731 |
| 2016 | $5,600 | $263,134 | $71,999 | $191,135 |
| 2015 | $5,502 | $259,183 | $70,918 | $188,265 |
| 2014 | $5,363 | $254,105 | $69,528 | $184,577 |
Source: Public Records
Map
Nearby Homes
- 1515 Derby St
- 2750 Sacramento St
- 1450 Ward St
- 1612 Parker St
- 2758 Sacramento St
- 1612 Carleton St
- 2774 Sacramento St
- 2782 Sacramento St
- 2790 Sacramento St
- 1142 Dwight Way
- 1530 Stuart St
- 1645 Dwight Way
- 1118 Dwight Way
- 2727 McGee Ave
- 2324 Browning St
- 2751 Wallace St
- 2747 San Pablo Ave Unit 507
- 1092 Dwight Way
- 2922 Stanton St
- 1535 Julia St
Your Personal Tour Guide
Ask me questions while you tour the home.