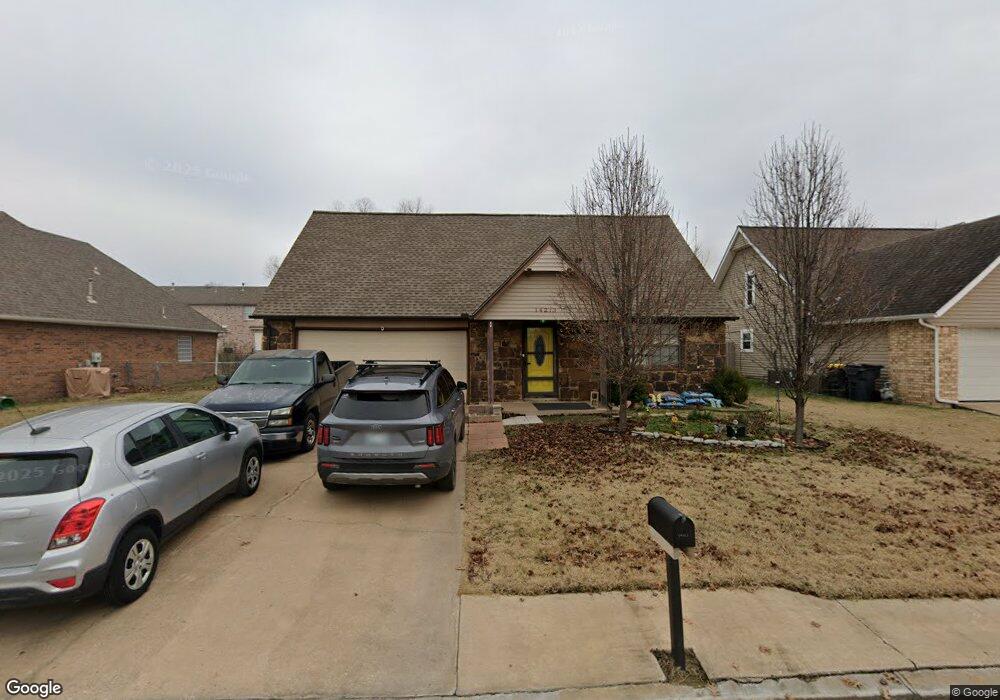
14213 S Glen St Glenpool, OK 74033
Estimated Value: $199,046 - $207,000
3
Beds
2
Baths
1,388
Sq Ft
$146/Sq Ft
Est. Value
About This Home
This home is located at 14213 S Glen St, Glenpool, OK 74033 and is currently estimated at $203,012, approximately $146 per square foot. 14213 S Glen St is a home located in Tulsa County with nearby schools including Glenpool Elementary School, Glenpool Middle School, and Glenpool High School.
Ownership History
Date
Name
Owned For
Owner Type
Purchase Details
Closed on
Jan 20, 2009
Sold by
Stockton Derrick R
Bought by
Smith Shannon D and Smith William T
Current Estimated Value
Home Financials for this Owner
Home Financials are based on the most recent Mortgage that was taken out on this home.
Original Mortgage
$107,317
Outstanding Balance
$67,507
Interest Rate
5.09%
Mortgage Type
FHA
Estimated Equity
$135,505
Purchase Details
Closed on
Jun 27, 2003
Sold by
Williamson Leonard E and Williamson Jennie
Bought by
Stockton Derrick R
Home Financials for this Owner
Home Financials are based on the most recent Mortgage that was taken out on this home.
Original Mortgage
$91,278
Interest Rate
5.27%
Mortgage Type
FHA
Purchase Details
Closed on
May 25, 2001
Sold by
Rapson Carl Allen and Rapson Leeta Loy
Bought by
Nelson Jennie and Williamson Leonard E
Create a Home Valuation Report for This Property
The Home Valuation Report is an in-depth analysis detailing your home's value as well as a comparison with similar homes in the area
Home Values in the Area
Average Home Value in this Area
Purchase History
| Date | Buyer | Sale Price | Title Company |
|---|---|---|---|
| Smith Shannon D | $108,000 | First American Title & Abstr | |
| Stockton Derrick R | $92,000 | Multiple | |
| Nelson Jennie | $72,500 | First Amer Title & Abstract |
Source: Public Records
Mortgage History
| Date | Status | Borrower | Loan Amount |
|---|---|---|---|
| Open | Smith Shannon D | $107,317 | |
| Previous Owner | Stockton Derrick R | $91,278 |
Source: Public Records
Tax History Compared to Growth
Tax History
| Year | Tax Paid | Tax Assessment Tax Assessment Total Assessment is a certain percentage of the fair market value that is determined by local assessors to be the total taxable value of land and additions on the property. | Land | Improvement |
|---|---|---|---|---|
| 2024 | $1,589 | $14,255 | $1,568 | $12,687 |
| 2023 | $1,589 | $13,576 | $1,380 | $12,196 |
| 2022 | $1,490 | $12,930 | $1,892 | $11,038 |
| 2021 | $1,483 | $12,675 | $1,854 | $10,821 |
| 2020 | $1,494 | $12,675 | $1,854 | $10,821 |
| 2019 | $1,505 | $12,675 | $1,854 | $10,821 |
| 2018 | $1,498 | $12,675 | $1,854 | $10,821 |
| 2017 | $1,466 | $12,675 | $1,854 | $10,821 |
| 2016 | $1,457 | $12,474 | $1,825 | $10,649 |
| 2015 | $1,381 | $11,880 | $1,738 | $10,142 |
| 2014 | $1,387 | $11,880 | $1,738 | $10,142 |
Source: Public Records
Map
Nearby Homes
- 655 E 142nd Place
- 687 E 142nd Place
- 797 E 142nd Place
- 660 E 143rd St
- 14111 S Hickory Place
- 14105 S Hickory Place
- 14324 S Dogwood St
- 13936 S Ironwood Place
- 750 E 139th Place
- 642 E 138th Place
- 745 E 139th Place S
- 393 E 147th St S
- 780 E 139th Place
- 1057 E 144th St
- 475 E 138th Place
- 243 E 141st St
- 394 E 147th St S
- 14336 S Barber St
- 1122 E 144th Place
- 14760 S Fern Place
- 14237 S Glen St
- 14201 S Glen St
- 14228 S Hickory St
- 14234 S Hickory St
- 14220 S Hickory St
- 14238 S Hickory St
- 14216 S Hickory St
- 492 E 142nd St
- 14246 S Hickory St
- 14212 S Hickory St
- 491 E 142nd Place
- 14250 S Hickory St
- 14177 S Glen St
- 14208 S Hickory St
- 493 E 142nd St
- 14256 S Hickory St
- 14198 S Hickory St
- 14184 S Hickory St
- 482 E 142nd St
- 14165 S Glen St