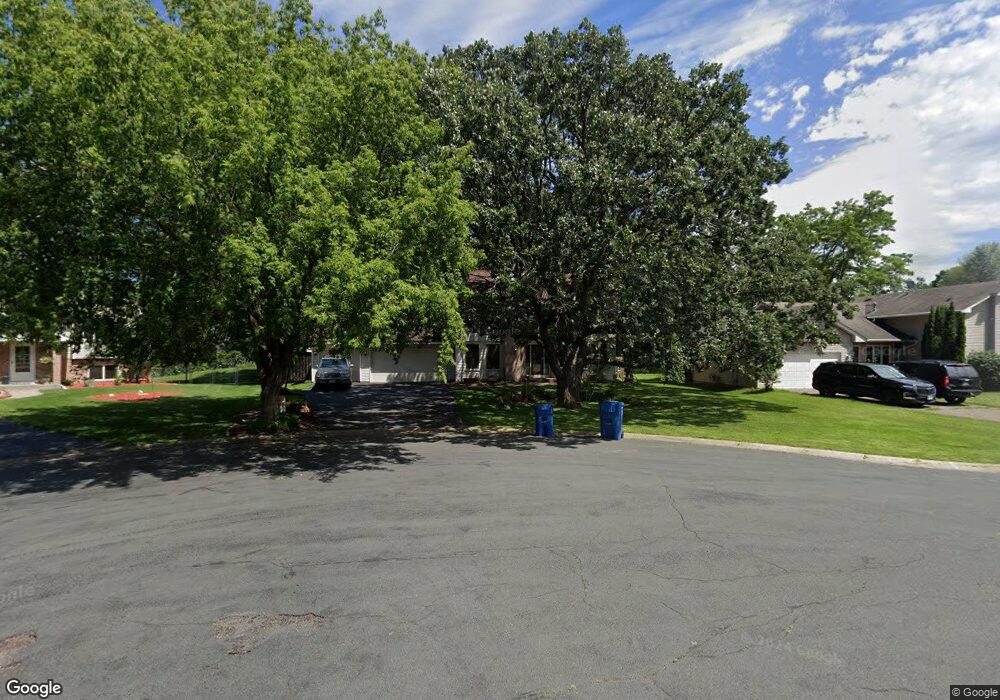
14215 Silverod St NW Andover, MN 55304
Estimated Value: $393,000 - $473,000
3
Beds
4
Baths
1,667
Sq Ft
$258/Sq Ft
Est. Value
About This Home
This home is located at 14215 Silverod St NW, Andover, MN 55304 and is currently estimated at $430,071, approximately $257 per square foot. 14215 Silverod St NW is a home located in Anoka County with nearby schools including Crooked Lake Elementary School, Oak View Middle School, and Andover Senior High School.
Ownership History
Date
Name
Owned For
Owner Type
Purchase Details
Closed on
Jul 16, 2018
Sold by
Paddock Todd
Bought by
Epp Stephen and Epp Noelle
Current Estimated Value
Home Financials for this Owner
Home Financials are based on the most recent Mortgage that was taken out on this home.
Original Mortgage
$315,400
Outstanding Balance
$273,341
Interest Rate
4.5%
Mortgage Type
New Conventional
Estimated Equity
$156,730
Purchase Details
Closed on
Aug 15, 2016
Sold by
Ferguson Allan J and Ferguson Rachael C
Bought by
Paddock Todd
Home Financials for this Owner
Home Financials are based on the most recent Mortgage that was taken out on this home.
Original Mortgage
$315,065
Interest Rate
3.41%
Mortgage Type
VA
Purchase Details
Closed on
Jun 30, 2005
Sold by
Strand Paul M and Strand Judy L
Bought by
Ferguson Allan J and Cooper Rachel C
Create a Home Valuation Report for This Property
The Home Valuation Report is an in-depth analysis detailing your home's value as well as a comparison with similar homes in the area
Home Values in the Area
Average Home Value in this Area
Purchase History
| Date | Buyer | Sale Price | Title Company |
|---|---|---|---|
| Epp Stephen | $332,000 | Liberty Title Inc | |
| Paddock Todd | $305,000 | Executive Title Northwest Ll | |
| Ferguson Allan J | $289,900 | -- |
Source: Public Records
Mortgage History
| Date | Status | Borrower | Loan Amount |
|---|---|---|---|
| Open | Epp Stephen | $315,400 | |
| Previous Owner | Paddock Todd | $315,065 |
Source: Public Records
Tax History Compared to Growth
Tax History
| Year | Tax Paid | Tax Assessment Tax Assessment Total Assessment is a certain percentage of the fair market value that is determined by local assessors to be the total taxable value of land and additions on the property. | Land | Improvement |
|---|---|---|---|---|
| 2025 | $3,843 | $408,400 | $122,000 | $286,400 |
| 2024 | $3,843 | $380,800 | $102,900 | $277,900 |
| 2023 | $3,835 | $395,500 | $102,900 | $292,600 |
| 2022 | $3,518 | $411,800 | $93,500 | $318,300 |
| 2021 | $3,412 | $331,100 | $78,600 | $252,500 |
| 2020 | $3,499 | $314,700 | $74,900 | $239,800 |
| 2019 | $3,323 | $312,700 | $71,400 | $241,300 |
| 2018 | $3,729 | $292,300 | $0 | $0 |
| 2017 | $2,777 | $271,100 | $0 | $0 |
| 2016 | $2,889 | $240,500 | $0 | $0 |
| 2015 | -- | $240,500 | $59,900 | $180,600 |
| 2014 | -- | $196,900 | $39,000 | $157,900 |
Source: Public Records
Map
Nearby Homes
- 3740 143rd Ave NW
- 14545 Round Lake Blvd NW
- 3996 145th Ave NW
- 3300 138th Ave NW
- 4212 141st Ln NW
- 926 38th Ave
- 13871 Eidelweiss St NW
- 13565 Jonquil St NW
- 805 9th Ave
- 4356 141st Ln NW
- TBD Gladiola St NW
- 956 Blackoaks Ln
- Lot 5 Gladiola St NW
- 948 Norwood Ave
- 3860 7th Ave
- 13414 Jonquil St NW
- 13334 Silverod Ct NW
- 1410 Cleveland St
- 3857 & 3861 9th Ln
- 13230 Meadowood Trail NW Unit 102
- 14207 Silverod St NW
- 14223 Silverod St NW
- 14220 Rose St NW
- 14210 Rose St NW
- 14232 Silverod St NW
- 14230 Rose St NW
- 14208 Silverod St NW
- 14224 Silverod St NW
- 14216 Silverod St NW
- 3532 142nd Ave NW
- 3530 142nd Ln NW
- 3544 142nd Ln NW
- 3542 142nd Ave NW
- 14240 Rose St NW
- 3512 142nd Ave NW
- 3518 142nd Ln NW
- 3560 142nd Ln NW
- 3510 142nd Ln NW
- 14209 Rose St NW
- 3554 142nd Ave NW