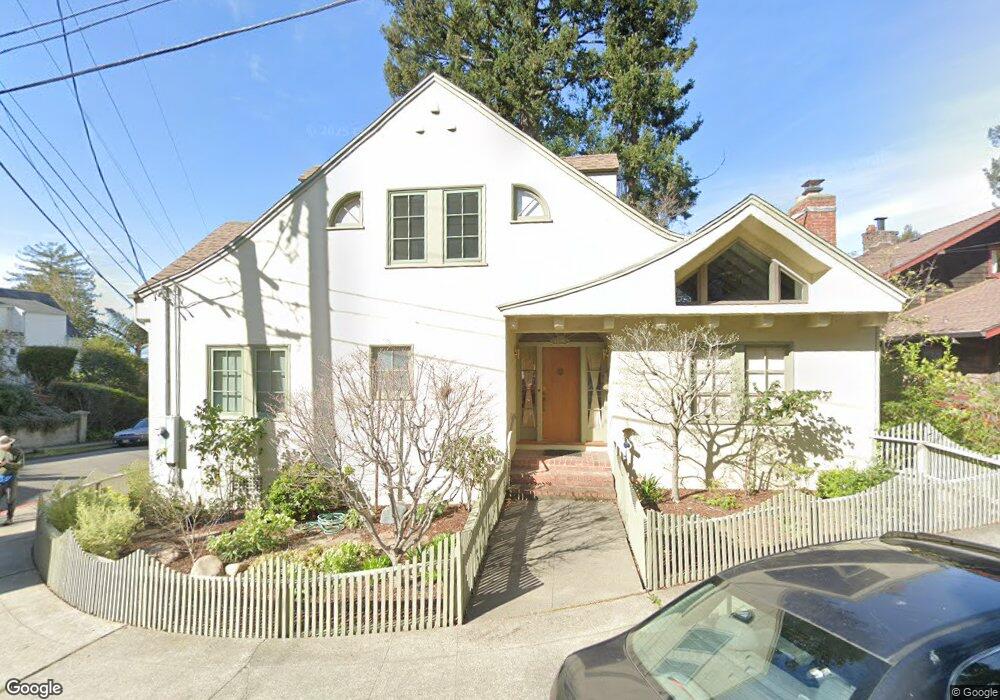
1422 Scenic Ave Berkeley, CA 94708
Berkeley Hills NeighborhoodEstimated Value: $1,564,481 - $2,013,000
3
Beds
2
Baths
1,948
Sq Ft
$881/Sq Ft
Est. Value
About This Home
This home is located at 1422 Scenic Ave, Berkeley, CA 94708 and is currently estimated at $1,716,620, approximately $881 per square foot. 1422 Scenic Ave is a home located in Alameda County with nearby schools including Berkeley Arts Magnet at Whittier School, Cragmont Elementary School, and Washington Elementary School.
Ownership History
Date
Name
Owned For
Owner Type
Purchase Details
Closed on
Aug 20, 2020
Sold by
Dillon Robert J and Dillon Madeline
Bought by
Dillon Robert J and Dillon Madeline
Current Estimated Value
Purchase Details
Closed on
Oct 18, 2013
Sold by
Deroulhac Gregoire and The Nello Pace & Mary Jo Pace
Bought by
Dillon Robert J and Dillon Madeline
Home Financials for this Owner
Home Financials are based on the most recent Mortgage that was taken out on this home.
Original Mortgage
$724,500
Outstanding Balance
$513,875
Interest Rate
3.12%
Mortgage Type
Adjustable Rate Mortgage/ARM
Estimated Equity
$1,202,745
Purchase Details
Closed on
Jan 15, 1996
Sold by
Pace Nello and Pace Mary Jo
Bought by
Pace Pace Mary Jo Mary Jo and Pace Nello
Create a Home Valuation Report for This Property
The Home Valuation Report is an in-depth analysis detailing your home's value as well as a comparison with similar homes in the area
Home Values in the Area
Average Home Value in this Area
Purchase History
| Date | Buyer | Sale Price | Title Company |
|---|---|---|---|
| Dillon Robert J | -- | None Available | |
| Dillon Robert J | $1,035,000 | Chicago Title Company | |
| Pace Pace Mary Jo Mary Jo | -- | -- |
Source: Public Records
Mortgage History
| Date | Status | Borrower | Loan Amount |
|---|---|---|---|
| Open | Dillon Robert J | $724,500 |
Source: Public Records
Tax History
| Year | Tax Paid | Tax Assessment Tax Assessment Total Assessment is a certain percentage of the fair market value that is determined by local assessors to be the total taxable value of land and additions on the property. | Land | Improvement |
|---|---|---|---|---|
| 2025 | $19,264 | $1,268,713 | $380,614 | $888,099 |
| 2024 | $19,264 | $1,243,841 | $373,152 | $870,689 |
| 2023 | $18,813 | $1,219,457 | $365,837 | $853,620 |
| 2022 | $18,428 | $1,195,548 | $358,664 | $836,884 |
| 2021 | $18,485 | $1,172,116 | $351,635 | $820,481 |
| 2020 | $17,537 | $1,160,100 | $348,030 | $812,070 |
| 2019 | $16,893 | $1,137,361 | $341,208 | $796,153 |
| 2018 | $16,614 | $1,115,067 | $334,520 | $780,547 |
| 2017 | $16,058 | $1,093,207 | $327,962 | $765,245 |
| 2016 | $15,564 | $1,071,773 | $321,532 | $750,241 |
| 2015 | $15,350 | $1,055,678 | $316,703 | $738,975 |
| 2014 | $15,251 | $1,035,000 | $310,500 | $724,500 |
Source: Public Records
Map
Nearby Homes
- 1444 Walnut St
- 2340 Virginia St
- 2600 Hilgard Ave
- 2451 Le Conte Ave
- 2201 Virginia St Unit 2
- 2634 Virginia St Unit 13
- 2012 Rose St
- 2700 Le Conte Ave Unit 301
- 2700 Le Conte Ave Unit 402
- 1136 Keith Ave
- 1610 Milvia St
- 1609 Bonita Ave Unit 3
- 1609 Bonita Ave Unit 5
- 1425 Martin Luther King jr Way
- 1165 Cragmont Ave
- 1106 Cragmont Ave
- 2015 Delaware St
- 2015 Delaware St Unit A
- 0 Queens Rd Unit ML82024219
- 1375 Queens Rd
- 1410 Scenic Ave
- 1406 Scenic Ave
- 1443 Scenic Ave
- 1425 Scenic Ave
- 1405 Spring Way
- 1409 Scenic Ave
- 1423 Scenic Ave
- 1400 Scenic Ave
- 1451 Scenic Ave
- 1407 Scenic Ave
- 1418 Spring Way
- 1408 Spring Way
- 1424 Hawthorne Terrace
- 1404 Spring Way
- 1417 Arch St
- 1417 Arch St
- 1416 Hawthorne Terrace
- 1410 Hawthorne Terrace
- 1402 Spring Way
- 1457 Scenic Ave
Your Personal Tour Guide
Ask me questions while you tour the home.