
14225 S Highway 68 Saint James, MO 65559
Estimated payment $629/month
Highlights
- Popular Property
- Horses Allowed On Property
- Pond
About This Lot
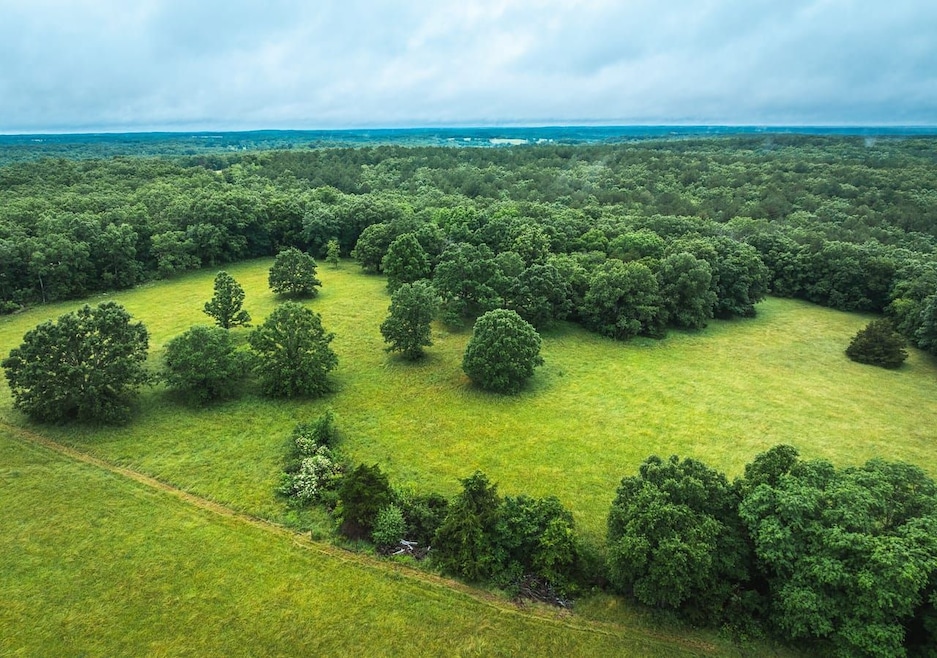
Gorgeous acreage with county road frontage just 20 minutes from St. James, MO, and only 1.5 hours from St. Louis. This beautiful property features mature timber, rolling hills, and about 5 acres of lush green pastureideal for a mini farm, horses, or building your dream home. A small pond adds charm and functionality, and electric is nearby for easy development. Located in the heart of Missouri wine country, the area is known for its scenic beauty and recreational opportunities. Deer and turkey are abundant, making it a nature lover’s or hunter’s dream.
Living Dream
Listed on: 06/19/2025

Property Details
Property Type
- Land
Est. Annual Taxes
- $1,441
Lot Details
- Current uses include hunting/fishing, timber
- Potential uses include for development
Additional Features
- Pond
- Horses Allowed On Property
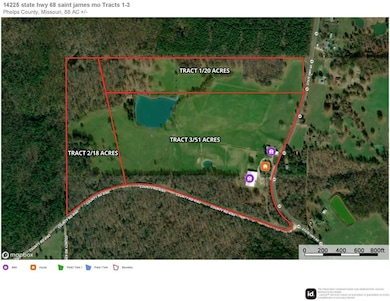
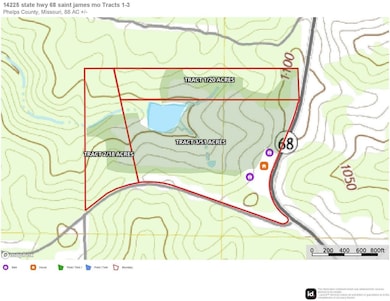
Map
Home Values in the Area
Average Home Value in this Area
Tax History
| Year | Tax Paid | Tax Assessment Tax Assessment Total Assessment is a certain percentage of the fair market value that is determined by local assessors to be the total taxable value of land and additions on the property. | Land | Improvement |
|---|---|---|---|---|
| 2024 | $1,441 | $34,570 | $3,690 | $30,880 |
| 2023 | $1,439 | $34,570 | $3,690 | $30,880 |
| 2022 | $1,446 | $34,570 | $3,690 | $30,880 |
| 2021 | $1,448 | $34,570 | $3,690 | $30,880 |
| 2020 | $1,378 | $32,520 | $3,690 | $28,830 |
| 2019 | $1,374 | $32,520 | $3,690 | $28,830 |
| 2018 | $1,376 | $32,520 | $3,690 | $28,830 |
| 2017 | $1,376 | $32,520 | $3,690 | $28,830 |
| 2016 | $1,324 | $32,520 | $3,690 | $28,830 |
| 2015 | -- | $32,520 | $3,690 | $28,830 |
| 2014 | -- | $32,070 | $3,240 | $28,830 |
| 2013 | -- | $32,070 | $0 | $0 |
Property History
| Date | Event | Price | Change | Sq Ft Price |
|---|---|---|---|---|
| 06/19/2025 06/19/25 | For Sale | $925,000 | +905.4% | $421 / Sq Ft |
| 06/19/2025 06/19/25 | For Sale | $92,000 | -8.0% | -- |
| 06/19/2025 06/19/25 | For Sale | $100,000 | -- | -- |
Purchase History
| Date | Type | Sale Price | Title Company |
|---|---|---|---|
| Deed | $400,000 | -- |
- 14225 S Highway 68 Tract 3
- 14225 S Highway 68 Tract 1
- 14225 S Highway 68 Tract 2
- 14225 S Highway 68 Tract 4
- 0 Dogwood Ln
- 17130 State Route F
- 11175 Missouri 68
- 11175 S Highway 68
- 0 Cedar Ford Unit MAR25009750
- 0 Cedar Ford Unit MAR24066263
- 14035 County Road 4110
- 1 Cedar Ford Rd
- 113750 State Route F
- 15130 State Route F
- TBD Private Drive 3215 (Tract #2)
- TBD Private Drive 3215 (Tract#1)
- 0 Cedar Ford Tract 2b Rd