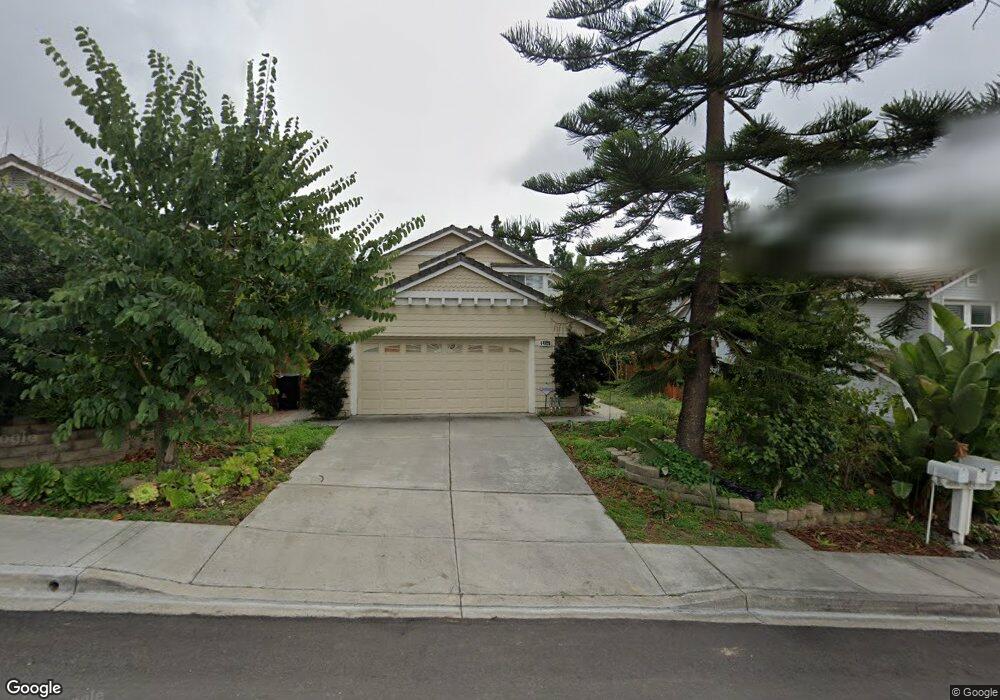
14225 Stoney Gate Place San Diego, CA 92128
Carmel Mountain NeighborhoodEstimated Value: $1,174,000 - $1,309,000
3
Beds
3
Baths
1,707
Sq Ft
$721/Sq Ft
Est. Value
About This Home
This home is located at 14225 Stoney Gate Place, San Diego, CA 92128 and is currently estimated at $1,231,378, approximately $721 per square foot. 14225 Stoney Gate Place is a home located in San Diego County with nearby schools including Shoal Creek Elementary School, Meadowbrook Middle, and Rancho Bernardo High.
Ownership History
Date
Name
Owned For
Owner Type
Purchase Details
Closed on
Feb 8, 2021
Sold by
Mai Hung Duy
Bought by
Mai Hung Duy and Nguyen Susan Uyen
Current Estimated Value
Purchase Details
Closed on
Mar 25, 2013
Sold by
Mai Hung Duy
Bought by
Mai Hung Duy
Home Financials for this Owner
Home Financials are based on the most recent Mortgage that was taken out on this home.
Original Mortgage
$386,000
Outstanding Balance
$271,772
Interest Rate
3.49%
Mortgage Type
New Conventional
Estimated Equity
$959,606
Purchase Details
Closed on
Jul 1, 2004
Sold by
Mai Hue Thi Dang
Bought by
Mai Hung Duy
Purchase Details
Closed on
Jul 8, 2003
Sold by
Mai Hung Duy and Nguyen Susan Uyen
Bought by
Mai Hung Duy and Mai Hue Dang
Home Financials for this Owner
Home Financials are based on the most recent Mortgage that was taken out on this home.
Original Mortgage
$200,000
Interest Rate
5.15%
Mortgage Type
Credit Line Revolving
Purchase Details
Closed on
Feb 1, 1989
Create a Home Valuation Report for This Property
The Home Valuation Report is an in-depth analysis detailing your home's value as well as a comparison with similar homes in the area
Home Values in the Area
Average Home Value in this Area
Purchase History
| Date | Buyer | Sale Price | Title Company |
|---|---|---|---|
| Mai Hung Duy | -- | None Available | |
| Mai Hung Duy | -- | Ticor Title Company Of Ca | |
| Mai Hung Duy | -- | -- | |
| Mai Hung Duy | -- | New Century Title Company | |
| -- | $190,700 | -- |
Source: Public Records
Mortgage History
| Date | Status | Borrower | Loan Amount |
|---|---|---|---|
| Open | Mai Hung Duy | $386,000 | |
| Closed | Mai Hung Duy | $200,000 |
Source: Public Records
Tax History Compared to Growth
Tax History
| Year | Tax Paid | Tax Assessment Tax Assessment Total Assessment is a certain percentage of the fair market value that is determined by local assessors to be the total taxable value of land and additions on the property. | Land | Improvement |
|---|---|---|---|---|
| 2025 | $3,725 | $357,870 | $137,434 | $220,436 |
| 2024 | $3,725 | $350,854 | $134,740 | $216,114 |
| 2023 | $3,643 | $343,976 | $132,099 | $211,877 |
| 2022 | $3,585 | $337,232 | $129,509 | $207,723 |
| 2021 | $3,517 | $330,620 | $126,970 | $203,650 |
| 2020 | $3,479 | $327,231 | $125,669 | $201,562 |
| 2019 | $3,390 | $320,815 | $123,205 | $197,610 |
| 2018 | $3,294 | $314,526 | $120,790 | $193,736 |
| 2017 | $3,227 | $308,360 | $118,422 | $189,938 |
| 2016 | $3,160 | $302,314 | $116,100 | $186,214 |
| 2015 | $3,112 | $297,774 | $114,357 | $183,417 |
| 2014 | $3,037 | $291,942 | $112,117 | $179,825 |
Source: Public Records
Map
Nearby Homes
- 13731 Sorbonne Ct
- 14346 Savannah Ct
- 14136 Capewood Ln
- 14215 Jonah Way
- 12026 Riley Ln
- 10572 Rancho Carmel Dr
- 12061 Tivoli Park Row Unit 3
- 12047 Tivoli Park Row Unit 3
- 11244 Woodrush Ln
- 10462 Rancho Carmel Dr
- 12224 Mulholland Ct
- 12021 Sienna Ln
- 11201 Woodrush Ct
- 11986 Tivoli Park Row
- 10378 Rancho Carmel Dr
- 14106 Brent Wilsey Place Unit 3
- 13737 Esprit Ave
- 12127 Corte Napoli
- Residence 2 Plan at The Trails - Ashton
- Residence 3 Plan at The Trails - Ashton
- 14211 Stoney Gate Place
- 14233 Stoney Gate Place Unit 20C
- 14191 Stoney Gate Place
- 14237 Stoney Gate Place
- 14243 Stoney Gate Place
- 14183 Stoney Gate Place
- 14218 Stoney Gate Place
- 14226 Stoney Gate Place
- 14210 Stoney Gate Place
- 14234 Stoney Gate Place
- 14175 Stoney Gate Place
- 14249 Stoney Gate Place
- 14192 Stoney Gate Place
- 14242 Stoney Gate Place Unit 20C
- 14184 Stoney Gate Place
- 14161 Stoney Gate Place
- 14253 Stoney Gate Place
- 14176 Stoney Gate Place
- 14250 Stoney Gate Place
- 14151 Stoney Gate Place