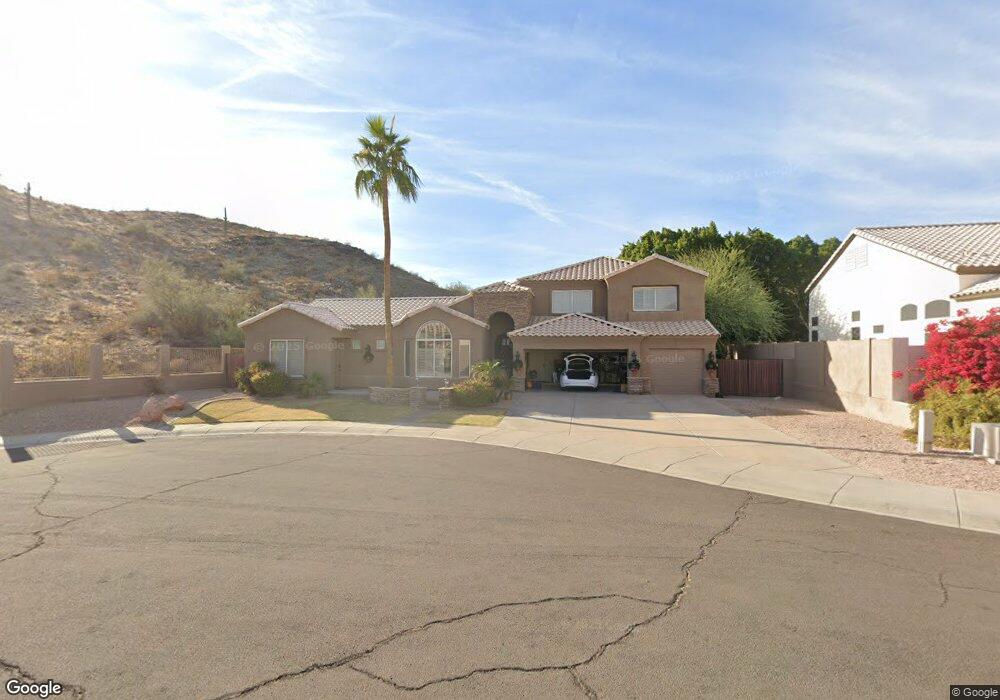
14228 S 10th St Phoenix, AZ 85048
Ahwatukee NeighborhoodEstimated Value: $824,605 - $913,000
5
Beds
4
Baths
3,111
Sq Ft
$278/Sq Ft
Est. Value
About This Home
This home is located at 14228 S 10th St, Phoenix, AZ 85048 and is currently estimated at $864,401, approximately $277 per square foot. 14228 S 10th St is a home located in Maricopa County with nearby schools including Kyrene de los Cerritos School, Kyrene Altadeña Middle School, and Desert Vista High School.
Ownership History
Date
Name
Owned For
Owner Type
Purchase Details
Closed on
Apr 20, 2004
Sold by
Lacivita Darcelle M
Bought by
Hale John R and Hale Helen A
Current Estimated Value
Home Financials for this Owner
Home Financials are based on the most recent Mortgage that was taken out on this home.
Original Mortgage
$309,000
Outstanding Balance
$142,668
Interest Rate
5.39%
Mortgage Type
New Conventional
Estimated Equity
$721,733
Purchase Details
Closed on
Jul 10, 2000
Sold by
Hakimi Bijan and Mohebbi Rayka
Bought by
Lacivita Darcelle M
Purchase Details
Closed on
Jun 5, 2000
Sold by
Lacivita Kenneth M
Bought by
Lacivita Darcelle M
Purchase Details
Closed on
May 24, 1994
Sold by
Mark Hancock Development Corp
Bought by
Hakimi Bijan and Mohebbi Rayka
Create a Home Valuation Report for This Property
The Home Valuation Report is an in-depth analysis detailing your home's value as well as a comparison with similar homes in the area
Home Values in the Area
Average Home Value in this Area
Purchase History
| Date | Buyer | Sale Price | Title Company |
|---|---|---|---|
| Hale John R | $389,000 | Security Title Agency | |
| Lacivita Darcelle M | $327,900 | Capital Title Agency | |
| Lacivita Darcelle M | -- | Capital Title Agency | |
| Hakimi Bijan | $219,708 | First American Title | |
| Mark Hancock Development Corp | -- | First American Title |
Source: Public Records
Mortgage History
| Date | Status | Borrower | Loan Amount |
|---|---|---|---|
| Open | Hale John R | $309,000 |
Source: Public Records
Tax History
| Year | Tax Paid | Tax Assessment Tax Assessment Total Assessment is a certain percentage of the fair market value that is determined by local assessors to be the total taxable value of land and additions on the property. | Land | Improvement |
|---|---|---|---|---|
| 2025 | $5,698 | $59,839 | -- | -- |
| 2024 | $5,404 | $56,990 | -- | -- |
| 2023 | $5,404 | $70,520 | $14,100 | $56,420 |
| 2022 | $5,147 | $53,500 | $10,700 | $42,800 |
| 2021 | $5,294 | $49,230 | $9,840 | $39,390 |
| 2020 | $5,362 | $48,550 | $9,710 | $38,840 |
| 2019 | $5,277 | $48,760 | $9,750 | $39,010 |
| 2018 | $5,096 | $49,470 | $9,890 | $39,580 |
| 2017 | $4,857 | $50,300 | $10,060 | $40,240 |
| 2016 | $4,902 | $50,550 | $10,110 | $40,440 |
| 2015 | $4,339 | $48,930 | $9,780 | $39,150 |
Source: Public Records
Map
Nearby Homes
- 908 E Mountain Sage Dr
- 1219 E Granite View Dr
- 14244 S 8th St
- 718 E Mountain Sage Dr
- 14234 S 7th St
- 815 E Desert Trumpet Rd
- 1367 E Desert Flower Ln
- 14811 S 13th Place
- 14815 S 13th Place
- 14239 S 14th St
- 15603 S 7th St
- 15608 S 7th St
- 136 E Desert Wind Dr
- 15045 S 6th Place
- 1349 E Sapium Way
- 14616 S 1st St
- 1682 E Desert Willow Dr Unit 4
- 785 E Windmere Dr
- 523 E Mountain Sky Ave
- 404 E Mountain Sky Ave
- 14218 S 10th St
- 915 E Mountain Sage Dr
- 907 E Mountain Sage Dr
- 14225 S 10th St
- 14231 S 10th St
- 14219 S 10th St
- 901 E Mountain Sage Dr
- 926 E Mountain Sage Dr
- 920 E Mountain Sage Dr
- 914 E Mountain Sage Dr
- 1002 E Mountain Sage Dr
- 831 E Mountain Sage Dr
- 1008 E Mountain Sage Dr
- 902 E Mountain Sage Dr
- 1202 E Granite View Dr
- 1012 E Mountain Sage Dr
- 825 E Mountain Sage Dr
- 832 E Mountain Sage Dr
- 1016 E Mountain Sage Dr
- 14236 S 12th St
Your Personal Tour Guide
Ask me questions while you tour the home.