Estimated Value: $908,000 - $969,917
3
Beds
2
Baths
1,170
Sq Ft
$802/Sq Ft
Est. Value
About This Home
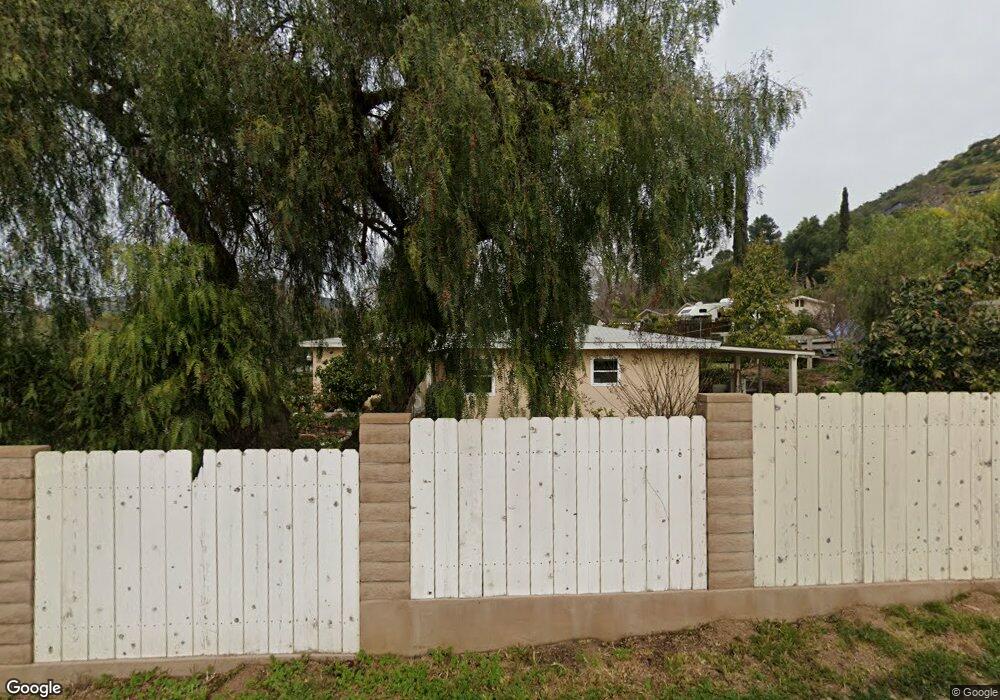
This home is located at 14243 Midland Rd, Poway, CA 92064 and is currently estimated at $937,979, approximately $801 per square foot. 14243 Midland Rd is a home located in San Diego County with nearby schools including Midland Elementary, Twin Peaks Middle, and Poway High.
Ownership History
Date
Name
Owned For
Owner Type
Purchase Details
Closed on
Feb 24, 2017
Sold by
Ta Peter V and Do Anh
Bought by
Ta Tom T and Ta Minh M
Current Estimated Value
Purchase Details
Closed on
Dec 6, 2006
Sold by
Ta Peter V and Do Anh
Bought by
Ta Peter and Do Anh
Purchase Details
Closed on
Jul 14, 2003
Sold by
Kane William J and Kane Sherrie L
Bought by
Ta Peter and Do Anh
Home Financials for this Owner
Home Financials are based on the most recent Mortgage that was taken out on this home.
Original Mortgage
$200,000
Outstanding Balance
$84,453
Interest Rate
5.17%
Mortgage Type
Purchase Money Mortgage
Estimated Equity
$853,526
Purchase Details
Closed on
Apr 21, 1993
Sold by
Hooton Walter S and Hooton Debra E
Bought by
Kane William J and Kane Sherrie L
Home Financials for this Owner
Home Financials are based on the most recent Mortgage that was taken out on this home.
Original Mortgage
$147,600
Interest Rate
6.81%
Purchase Details
Closed on
Sep 19, 1988
Purchase Details
Closed on
May 4, 1984
Create a Home Valuation Report for This Property
The Home Valuation Report is an in-depth analysis detailing your home's value as well as a comparison with similar homes in the area
Home Values in the Area
Average Home Value in this Area
Purchase History
| Date | Buyer | Sale Price | Title Company |
|---|---|---|---|
| Ta Tom T | -- | None Available | |
| Ta Peter | -- | None Available | |
| Ta Peter | $390,000 | United Title Company | |
| Kane William J | $169,000 | First American Title Co | |
| -- | $138,500 | -- | |
| -- | $88,500 | -- |
Source: Public Records
Mortgage History
| Date | Status | Borrower | Loan Amount |
|---|---|---|---|
| Open | Ta Peter | $200,000 | |
| Previous Owner | Kane William J | $147,600 |
Source: Public Records
Tax History
| Year | Tax Paid | Tax Assessment Tax Assessment Total Assessment is a certain percentage of the fair market value that is determined by local assessors to be the total taxable value of land and additions on the property. | Land | Improvement |
|---|---|---|---|---|
| 2025 | $7,414 | $665,664 | $447,238 | $218,426 |
| 2024 | $7,414 | $652,613 | $438,469 | $214,144 |
| 2023 | $7,258 | $639,818 | $429,872 | $209,946 |
| 2022 | $7,139 | $627,274 | $421,444 | $205,830 |
| 2021 | $7,047 | $614,976 | $413,181 | $201,795 |
| 2020 | $6,952 | $608,671 | $408,945 | $199,726 |
| 2019 | $6,773 | $596,737 | $400,927 | $195,810 |
| 2018 | $6,584 | $585,037 | $393,066 | $191,971 |
| 2017 | $5,457 | $487,014 | $341,603 | $145,411 |
| 2016 | $5,346 | $477,465 | $334,905 | $142,560 |
| 2015 | $5,268 | $470,294 | $329,875 | $140,419 |
| 2014 | $5,146 | $461,083 | $323,414 | $137,669 |
Source: Public Records
Map
Nearby Homes
- 14403 Gaslight Ct
- 13730 Holly Oak Way
- 13947 Midland Rd
- 14003 Jasmine Ave Unit 193
- 13908 Hibiscus Ave Unit 40
- 13941 Wisteria Ave
- 13780 Holly Oak Way
- 14015 Olive Meadows Place
- 13303 Betty Lee Way
- 13765 Holly Oak Way
- 13972 Poway Valley Rd
- 14637 Poway Mesa Dr
- 000 Carlson Ct 9 Unit 9
- 13422 Little Dawn Ln
- 13643 Melissa Ln
- 12885 Rockwell Ct
- 13619 Sycamore Tree Ln
- 14298 Ipava Dr
- 13650 Mulberry Tree Ct Unit 167
- 14725 Fieldview Way
- 14227 Midland Rd
- 14249 Midland Rd
- 13624 Vian Rd
- 14215 Midland Rd
- 13634 Vian Rd
- 13646 Vian Rd Unit 48
- 14203 Midland Rd
- 13650 Vian Rd
- 14305 Midland Rd
- 13624 Aubrey St
- (Vacant Lo Aubrey St
- 0 Midland Rd Unit CRP1-17612
- 0 Midland Rd Unit CRNDP2404024
- 0 Midland Rd Unit P1-17612
- 0 Midland Rd Unit 5 Acre 230013499
- 000 Midland Rd Unit 5 acre
- 0 Midland Rd
- 13656 Vian Rd
- 14319 Midland Rd
- 13640 Vian Rd
Your Personal Tour Guide
Ask me questions while you tour the home.