Estimated Value: $875,000 - $1,034,000
4
Beds
2
Baths
1,350
Sq Ft
$709/Sq Ft
Est. Value
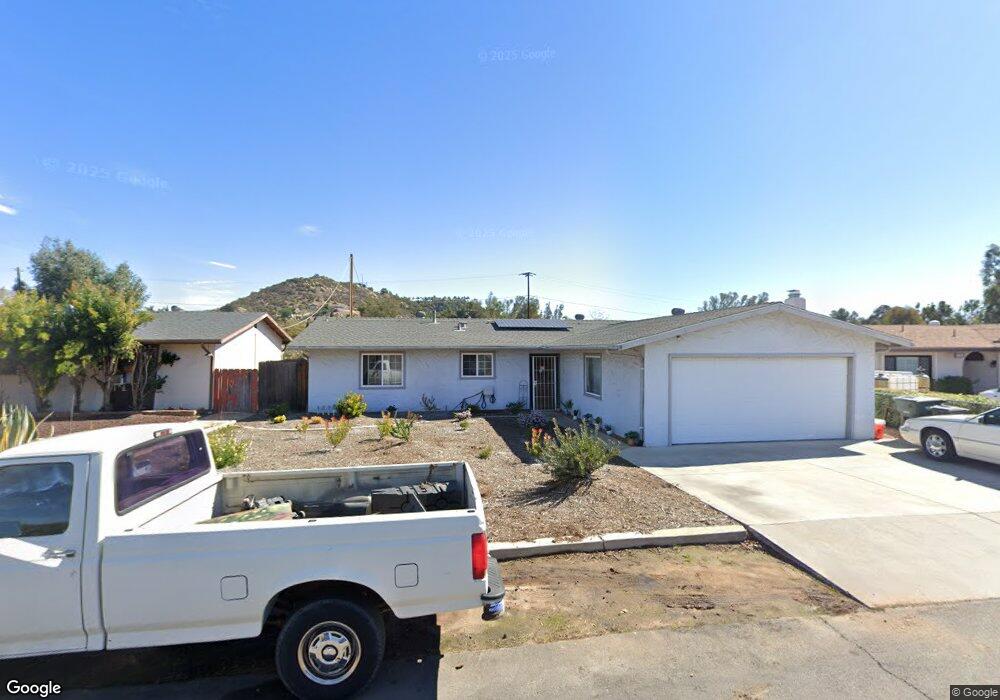
About This Home
This home is located at 14249 Old Community Rd, Poway, CA 92064 and is currently estimated at $956,870, approximately $708 per square foot. 14249 Old Community Rd is a home located in San Diego County with nearby schools including Midland Elementary, Twin Peaks Middle, and Poway High.
Ownership History
Date
Name
Owned For
Owner Type
Purchase Details
Closed on
Feb 7, 2008
Sold by
Bellefeuille Sherri A and Beeman Wayne
Bought by
Beeman Wayne and Bellefeuille Sherri A
Current Estimated Value
Purchase Details
Closed on
Jul 9, 2001
Sold by
Bellefeuille Sherri A
Bought by
Beeman Wayne and Bellefeuille Sherri A
Home Financials for this Owner
Home Financials are based on the most recent Mortgage that was taken out on this home.
Original Mortgage
$25,000
Interest Rate
7.21%
Mortgage Type
Credit Line Revolving
Purchase Details
Closed on
Jul 30, 1998
Sold by
Kruse and Sig
Bought by
Bellefeuille Sherri A
Home Financials for this Owner
Home Financials are based on the most recent Mortgage that was taken out on this home.
Original Mortgage
$149,760
Interest Rate
6.92%
Mortgage Type
Stand Alone First
Purchase Details
Closed on
Nov 9, 1989
Purchase Details
Closed on
Jun 30, 1987
Create a Home Valuation Report for This Property
The Home Valuation Report is an in-depth analysis detailing your home's value as well as a comparison with similar homes in the area
Home Values in the Area
Average Home Value in this Area
Purchase History
| Date | Buyer | Sale Price | Title Company |
|---|---|---|---|
| Beeman Wayne | -- | Commonwealth Land Title Co | |
| Beeman Wayne | -- | Fidelity National Title Co | |
| Bellefeuille Sherri A | $187,500 | Commonwealth Land Title Co | |
| -- | $173,000 | -- | |
| -- | $120,000 | -- |
Source: Public Records
Mortgage History
| Date | Status | Borrower | Loan Amount |
|---|---|---|---|
| Previous Owner | Beeman Wayne | $25,000 | |
| Previous Owner | Bellefeuille Sherri A | $149,760 |
Source: Public Records
Tax History
| Year | Tax Paid | Tax Assessment Tax Assessment Total Assessment is a certain percentage of the fair market value that is determined by local assessors to be the total taxable value of land and additions on the property. | Land | Improvement |
|---|---|---|---|---|
| 2025 | $3,247 | $293,449 | $152,662 | $140,787 |
| 2024 | $3,247 | $287,696 | $149,669 | $138,027 |
| 2023 | $3,178 | $282,056 | $146,735 | $135,321 |
| 2022 | $3,124 | $276,526 | $143,858 | $132,668 |
| 2021 | $3,083 | $271,105 | $141,038 | $130,067 |
| 2020 | $3,042 | $268,326 | $139,592 | $128,734 |
| 2019 | $2,963 | $263,065 | $136,855 | $126,210 |
| 2018 | $2,880 | $257,908 | $134,172 | $123,736 |
| 2017 | $173 | $252,852 | $131,542 | $121,310 |
| 2016 | $2,745 | $247,895 | $128,963 | $118,932 |
| 2015 | $2,705 | $244,172 | $127,026 | $117,146 |
| 2014 | $2,642 | $239,390 | $124,538 | $114,852 |
Source: Public Records
Map
Nearby Homes
- 14240 Kendra Way
- 14334 Sandown Ct
- 14120 Kendra Way
- 14403 Gaslight Ct
- 13780 Holly Oak Way
- 13947 Midland Rd
- 13765 Holly Oak Way
- 12885 Rockwell Ct
- 13908 Hibiscus Ave Unit 40
- 13941 Wisteria Ave
- 14003 Jasmine Ave Unit 193
- 14089 Pomegranate Ave Unit 214
- 14725 Fieldview Way
- 000 Carlson Ct 9 Unit 9
- 13619 Sycamore Tree Ln
- 13972 Poway Valley Rd
- 13976 Country Creek Rd
- 13650 Mulberry Tree Ct Unit 167
- 14613 Plumwood St
- 14109 Arbolitos Dr
- 14255 Old Community Rd
- 14245 Old Community Rd
- 14261 Old Community Rd
- 14237 Old Community Rd
- 14305 Old Community Rd
- 14252 York Ave
- 14233 Old Community Rd
- 14234 York Ave
- 14256 York Ave
- 14230 York Ave
- 14247 Kendra Way
- 14239 Kendra Way
- 14309 Old Community Rd
- 14266 York Ave
- 14301 Kendra Ct
- 14231 Kendra Way
- 14223 Old Community Rd
- 14307 Kendra Ct
- 14225 Kendra Way
- 14311 Old Community Rd
Your Personal Tour Guide
Ask me questions while you tour the home.