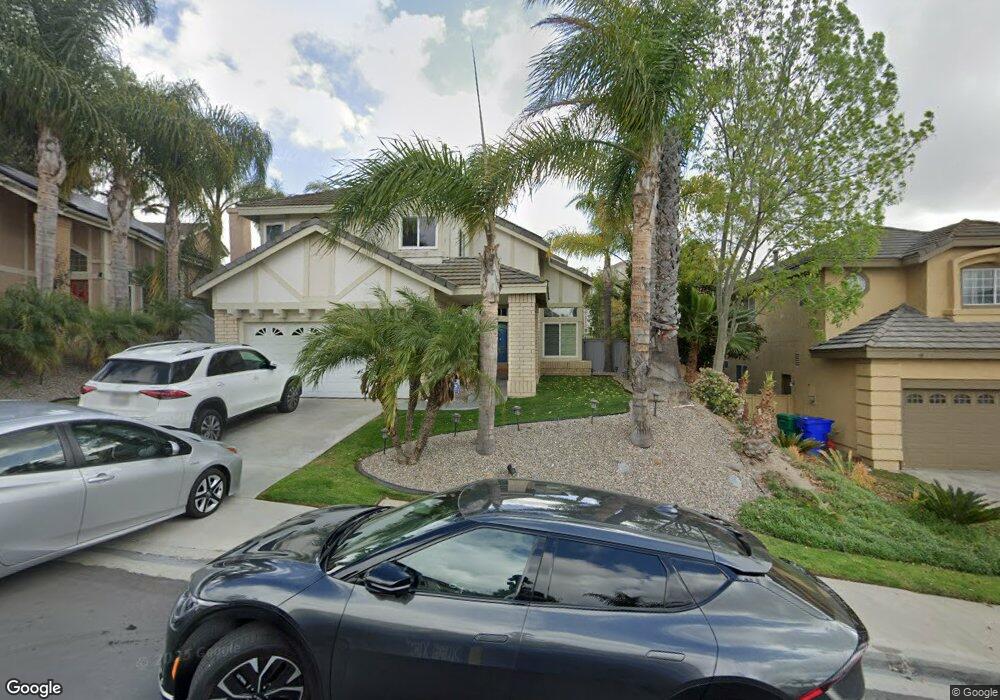
14255 Seabridge Ln San Diego, CA 92128
Carmel Mountain NeighborhoodEstimated Value: $1,371,393 - $1,444,000
3
Beds
3
Baths
2,169
Sq Ft
$642/Sq Ft
Est. Value
About This Home
This home is located at 14255 Seabridge Ln, San Diego, CA 92128 and is currently estimated at $1,392,848, approximately $642 per square foot. 14255 Seabridge Ln is a home located in San Diego County with nearby schools including Shoal Creek Elementary School, Bernardo Heights Middle, and Rancho Bernardo High.
Ownership History
Date
Name
Owned For
Owner Type
Purchase Details
Closed on
Aug 2, 2007
Sold by
Panah Manijeh F
Bought by
Zeighami Siamak
Current Estimated Value
Home Financials for this Owner
Home Financials are based on the most recent Mortgage that was taken out on this home.
Original Mortgage
$315,200
Outstanding Balance
$197,931
Interest Rate
6.5%
Mortgage Type
Stand Alone Refi Refinance Of Original Loan
Estimated Equity
$1,194,917
Purchase Details
Closed on
Feb 17, 1996
Sold by
Sanger Kenneth B and Sanger Donna R
Bought by
Zeighami Siamak and Panah Manijeh F
Home Financials for this Owner
Home Financials are based on the most recent Mortgage that was taken out on this home.
Original Mortgage
$218,500
Interest Rate
7.84%
Purchase Details
Closed on
Jul 25, 1989
Purchase Details
Closed on
Dec 21, 1988
Create a Home Valuation Report for This Property
The Home Valuation Report is an in-depth analysis detailing your home's value as well as a comparison with similar homes in the area
Home Values in the Area
Average Home Value in this Area
Purchase History
| Date | Buyer | Sale Price | Title Company |
|---|---|---|---|
| Zeighami Siamak | -- | Alliance Title San Diego | |
| Zeighami Siamak | $230,000 | Old Republic Title Company | |
| -- | $285,000 | -- | |
| -- | $237,700 | -- |
Source: Public Records
Mortgage History
| Date | Status | Borrower | Loan Amount |
|---|---|---|---|
| Open | Zeighami Siamak | $315,200 | |
| Previous Owner | Zeighami Siamak | $218,500 |
Source: Public Records
Tax History Compared to Growth
Tax History
| Year | Tax Paid | Tax Assessment Tax Assessment Total Assessment is a certain percentage of the fair market value that is determined by local assessors to be the total taxable value of land and additions on the property. | Land | Improvement |
|---|---|---|---|---|
| 2025 | $3,976 | $382,067 | $149,501 | $232,566 |
| 2024 | $3,976 | $374,576 | $146,570 | $228,006 |
| 2023 | $3,890 | $367,233 | $143,697 | $223,536 |
| 2022 | $3,828 | $360,033 | $140,880 | $219,153 |
| 2021 | $3,756 | $352,974 | $138,118 | $214,856 |
| 2020 | $3,715 | $349,355 | $136,702 | $212,653 |
| 2019 | $3,620 | $342,506 | $134,022 | $208,484 |
| 2018 | $3,517 | $335,792 | $131,395 | $204,397 |
| 2017 | $81 | $329,209 | $128,819 | $200,390 |
| 2016 | $3,375 | $322,755 | $126,294 | $196,461 |
| 2015 | $3,323 | $317,907 | $124,397 | $193,510 |
| 2014 | $3,244 | $311,681 | $121,961 | $189,720 |
Source: Public Records
Map
Nearby Homes
- 14136 Capewood Ln
- 14215 Jonah Way
- 13731 Sorbonne Ct
- 12112 Carter Ln
- 11986 Tivoli Park Row
- 10572 Rancho Carmel Dr
- 12192 Paxton Way
- 14106 Brent Wilsey Place Unit 3
- 12182 Paxton Way
- 12047 Tivoli Park Row Unit 3
- 12082 Gavin Way
- 12141 Paxton Way
- 12251 Allison Way
- 12475 Miranda Way
- 13703 Tradition St
- 12582 Taylor Way
- 10378 Rancho Carmel Dr
- 12127 Corte Napoli
- 14230 Jonah Way
- Residence 3 Plan at The Trails - Lavender
- 14265 Seabridge Ln
- 14247 Seabridge Ln
- 14273 Seabridge Ln
- 14239 Seabridge Ln Unit 16
- 14254 Seabridge Ln Unit 16
- 14281 Seabridge Ln
- 14246 Seabridge Ln
- 14272 Seabridge Ln
- 14231 Seabridge Ln
- 14232 Seabridge Ln
- 14282 Seabridge Ln
- 14303 Seabridge Ln
- 14223 Seabridge Ln
- 14304 Seabridge Ln
- 14222 Seabridge Ln
- 14311 Seabridge Ln
- 14215 Seabridge Ln
- 14310 Seabridge Ln
- 14216 Seabridge Ln
- 14319 Seabridge Ln