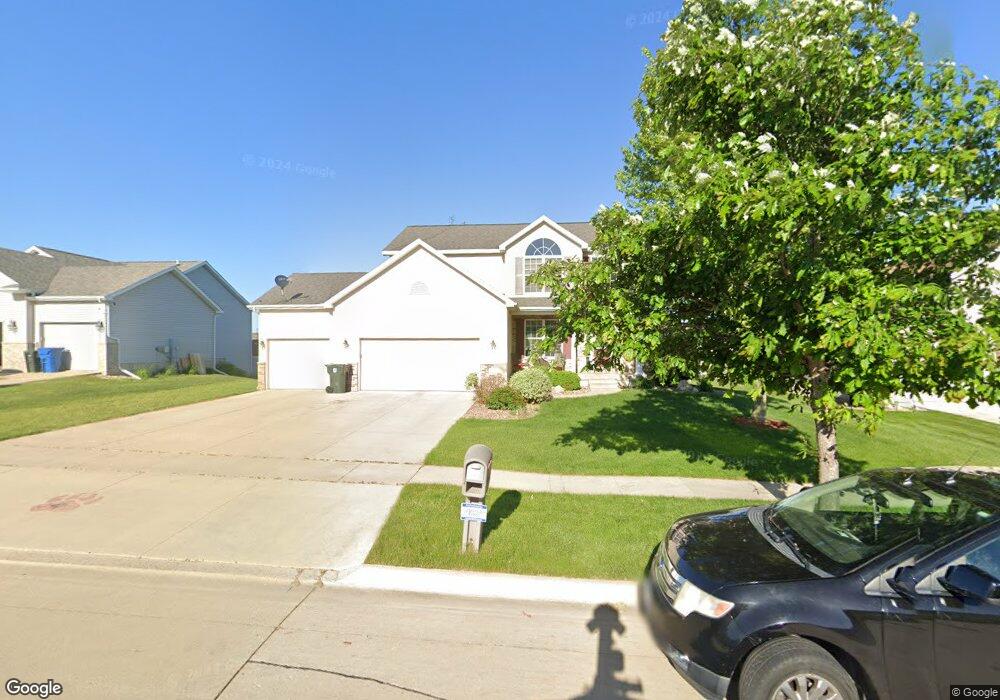
1426 Quail Ridge Rd Cedar Falls, IA 50613
Estimated Value: $437,781 - $487,000
4
Beds
6
Baths
2,220
Sq Ft
$210/Sq Ft
Est. Value
About This Home
This home is located at 1426 Quail Ridge Rd, Cedar Falls, IA 50613 and is currently estimated at $465,695, approximately $209 per square foot. 1426 Quail Ridge Rd is a home located in Black Hawk County with nearby schools including Bess Streeter Aldrich Elementary School, Holmes Junior High School, and Cedar Falls High School.
Ownership History
Date
Name
Owned For
Owner Type
Purchase Details
Closed on
Jan 4, 2018
Sold by
A S Holdings Llc
Bought by
E O Johnson Company Inc
Current Estimated Value
Purchase Details
Closed on
Jun 23, 2006
Sold by
Nelson Marvin D and Nelson Emilou J
Bought by
Nelson Marvin D and Nelson Emilou J
Purchase Details
Closed on
Dec 8, 2005
Sold by
Midwest Development Co
Bought by
Nelson Brad R and Nelson Jennifer J
Home Financials for this Owner
Home Financials are based on the most recent Mortgage that was taken out on this home.
Original Mortgage
$236,380
Interest Rate
6.48%
Mortgage Type
New Conventional
Create a Home Valuation Report for This Property
The Home Valuation Report is an in-depth analysis detailing your home's value as well as a comparison with similar homes in the area
Home Values in the Area
Average Home Value in this Area
Purchase History
| Date | Buyer | Sale Price | Title Company |
|---|---|---|---|
| E O Johnson Company Inc | $375,000 | None Available | |
| Nelson Marvin D | -- | None Available | |
| Nelson Brad R | $295,500 | Title Services Corporation |
Source: Public Records
Mortgage History
| Date | Status | Borrower | Loan Amount |
|---|---|---|---|
| Previous Owner | Nelson Brad R | $236,380 |
Source: Public Records
Tax History Compared to Growth
Tax History
| Year | Tax Paid | Tax Assessment Tax Assessment Total Assessment is a certain percentage of the fair market value that is determined by local assessors to be the total taxable value of land and additions on the property. | Land | Improvement |
|---|---|---|---|---|
| 2025 | $5,810 | $405,310 | $56,910 | $348,400 |
| 2024 | $5,810 | $361,020 | $56,910 | $304,110 |
| 2023 | $5,976 | $361,020 | $56,910 | $304,110 |
| 2022 | $6,048 | $323,660 | $56,910 | $266,750 |
| 2021 | $5,728 | $323,660 | $56,910 | $266,750 |
| 2020 | $5,616 | $307,680 | $52,530 | $255,150 |
| 2019 | $5,616 | $307,680 | $52,530 | $255,150 |
| 2018 | $5,686 | $307,680 | $52,530 | $255,150 |
| 2017 | $6,344 | $307,680 | $52,530 | $255,150 |
| 2016 | $5,938 | $336,030 | $52,530 | $283,500 |
| 2015 | $5,938 | $336,030 | $52,530 | $283,500 |
| 2014 | $5,546 | $310,260 | $52,530 | $257,730 |
Source: Public Records
Map
Nearby Homes
- 1618 Quail Ridge Rd
- 2126 Coventry Ln
- 4035 Broomfield Dr
- 2126 Oxford Ln
- 1104 Warwick Dr
- 2201 W 8th St
- 1916 Shelden Ave
- 1708 Yale Pkwy
- 1818 Yale Pkwy
- 4023 Broomfield Dr
- 538 Fireside Dr
- 4005 Broomfield Dr
- 3915 Broomfield Dr
- 3928 Broomfield Dr
- 3927 Broomfield Dr
- 4011 Broomfield Dr
- 1803 Yale Pkwy
- 3921 Broomfield Dr
- 4017 Broomfield Dr
- 3906 Keagles Crossing
- 1418 Quail Ridge Rd
- 1502 Quail Ridge Rd
- 1427 Quail Run Ln
- 1506 Quail Ridge Rd
- 1419 Quail Run Ln
- 1408 Quail Ridge Rd
- 1501 Quail Run Ln
- 1411 Quail Run Ln
- 1423 Quail Ridge Rd
- 2905 Wellington Dr
- 1507 Quail Run Ln
- 1516 Quail Ridge Rd
- 1417 Quail Ridge Rd
- 1402 Quail Ridge Rd
- 2906 Wellington Dr
- 1517 Quail Run Ln
- 1526 Quail Ridge Rd
- 1327 Quail Ridge Rd
- 2706 Feather Run Trail
- 2705 Feather Run Trail Unit 2705