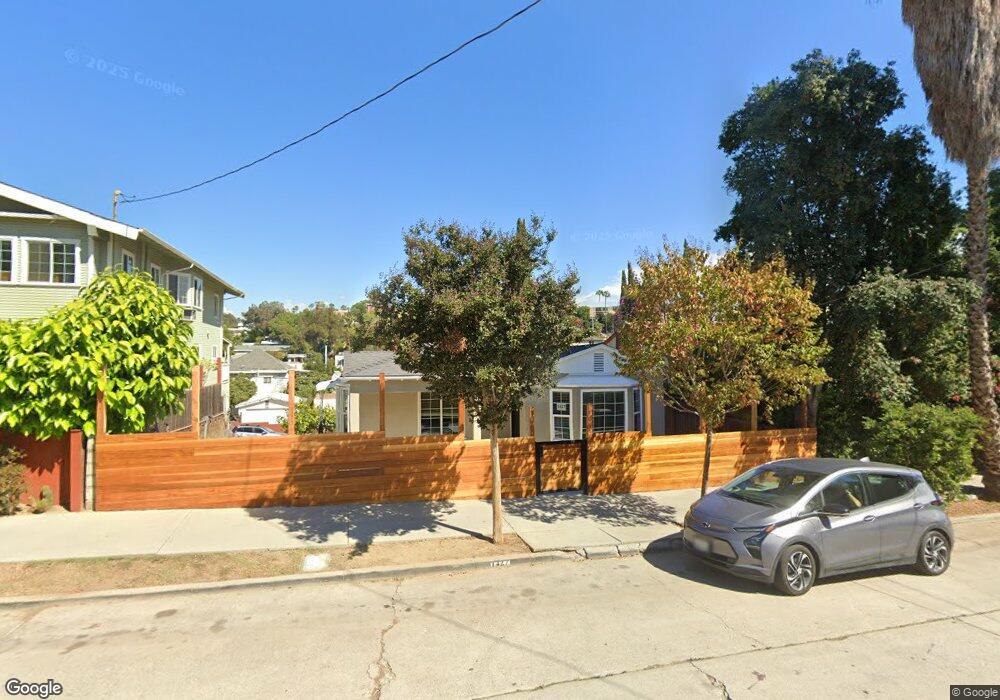
1427 Allison Ave Los Angeles, CA 90026
Echo Park NeighborhoodEstimated Value: $764,000 - $974,000
2
Beds
1
Bath
1,127
Sq Ft
$804/Sq Ft
Est. Value
About This Home
This home is located at 1427 Allison Ave, Los Angeles, CA 90026 and is currently estimated at $905,768, approximately $803 per square foot. 1427 Allison Ave is a home located in Los Angeles County with nearby schools including Logan Academy of Global Ecology, Ramón C. Cortines School of Visual and Performing Arts, and Belmont High School.
Ownership History
Date
Name
Owned For
Owner Type
Purchase Details
Closed on
Dec 12, 2018
Sold by
Sor James
Bought by
Sor James and The James Sor Trust
Current Estimated Value
Purchase Details
Closed on
Aug 15, 2013
Sold by
Sor James
Bought by
Sor James
Home Financials for this Owner
Home Financials are based on the most recent Mortgage that was taken out on this home.
Original Mortgage
$399,000
Outstanding Balance
$298,138
Interest Rate
4.51%
Mortgage Type
New Conventional
Estimated Equity
$607,630
Purchase Details
Closed on
Jul 26, 2000
Sold by
Tran Steven
Bought by
Sor James
Home Financials for this Owner
Home Financials are based on the most recent Mortgage that was taken out on this home.
Original Mortgage
$110,000
Interest Rate
8.2%
Purchase Details
Closed on
May 26, 2000
Sold by
Yip Yi Hoa
Bought by
Tran Steven
Purchase Details
Closed on
Mar 10, 1998
Sold by
Yip Yi Hoa
Bought by
Tran Steven and Yip Yi Hoa
Create a Home Valuation Report for This Property
The Home Valuation Report is an in-depth analysis detailing your home's value as well as a comparison with similar homes in the area
Home Values in the Area
Average Home Value in this Area
Purchase History
| Date | Buyer | Sale Price | Title Company |
|---|---|---|---|
| Sor James | -- | None Available | |
| Sor James | -- | Lsi Title Co | |
| Sor James | $160,000 | United Title Company | |
| Tran Steven | -- | United Title | |
| Tran Steven | -- | -- |
Source: Public Records
Mortgage History
| Date | Status | Borrower | Loan Amount |
|---|---|---|---|
| Open | Sor James | $399,000 | |
| Closed | Sor James | $110,000 |
Source: Public Records
Tax History Compared to Growth
Tax History
| Year | Tax Paid | Tax Assessment Tax Assessment Total Assessment is a certain percentage of the fair market value that is determined by local assessors to be the total taxable value of land and additions on the property. | Land | Improvement |
|---|---|---|---|---|
| 2025 | $3,071 | $241,068 | $189,850 | $51,218 |
| 2024 | $3,071 | $236,342 | $186,128 | $50,214 |
| 2023 | $3,015 | $231,709 | $182,479 | $49,230 |
| 2022 | $2,878 | $227,166 | $178,901 | $48,265 |
| 2021 | $2,839 | $222,713 | $175,394 | $47,319 |
| 2019 | $2,756 | $216,109 | $170,193 | $45,916 |
| 2018 | $2,692 | $211,872 | $166,856 | $45,016 |
| 2016 | $2,564 | $203,647 | $160,378 | $43,269 |
| 2015 | $2,528 | $200,589 | $157,969 | $42,620 |
| 2014 | $2,545 | $196,661 | $154,875 | $41,786 |
Source: Public Records
Map
Nearby Homes
- 1401 Allison Ave
- 1201 Douglas St
- 1443 Allison Ave
- 1462 W Sunset Blvd
- 1303 Lilac Terrace Unit 10
- 1500 Allison Ave
- 1259 Vin Scully Ave
- 1242 Lilac Place
- 843 Laveta Terrace
- 1432 Kellam Ave
- 1016 Laguna Ave
- 1400 Carroll Ave
- 1030 Echo Park Ave
- 1340 Carroll Ave
- 1251 W Sunset Blvd
- 1120 W Edgeware Rd
- 1236 W Sunset Blvd
- 1300 Carroll Ave
- 647 Laveta Terrace
- 1427 Laveta Terrace
- 1421 Allison Ave
- 1431 Allison Ave
- 1419 Allison Ave
- 1437 Allison Ave
- 1426 W Sunset Blvd
- 1432 W Sunset Blvd
- 1445 Allison Ave Unit 1/2
- 1436 W Sunset Blvd
- 1415 Allison Ave
- 1209 Douglas St
- 1447 Allison Ave
- 1211 Douglas St
- 1426 Allison Ave
- 1422 Allison Ave
- 1430 Allison Ave
- 1442 W Sunset Blvd
- 1416 Allison Ave
- 1434 Allison Ave
- 1410 Allison Ave
- 1453 Allison Ave